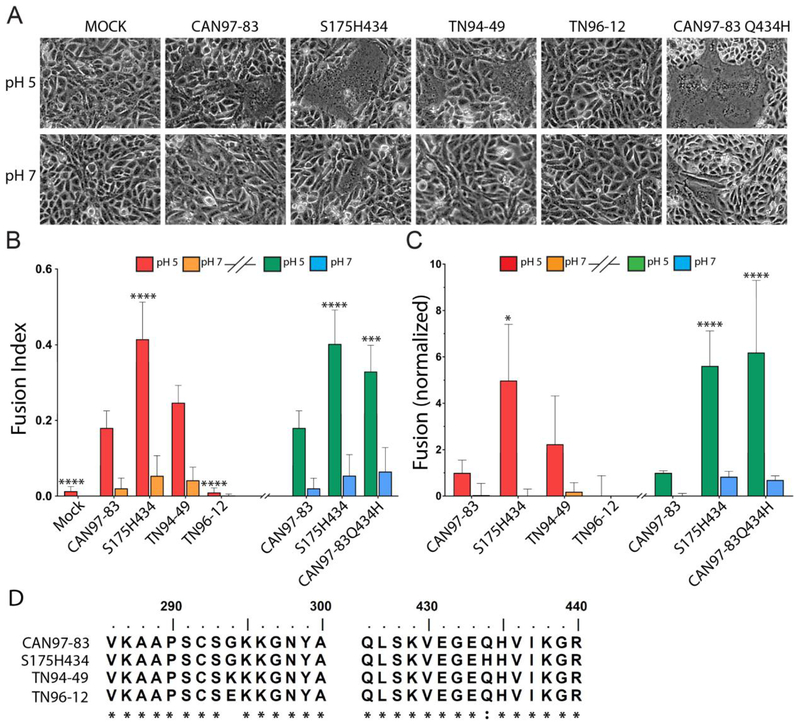
Fig 1. HMPV F proteins from different strains exhibit variable fusion activity promoted by low pH.
(A) Representative images of syncytia formation of cells expressing the HMPV F proteins after pulses at pH 5 or pH 7 (n = 3). (B) The fusion index was calculated using the equation f = [1 − (C/N)] where C is the number of cells in a field after fusion and N, the number of nuclei. Six fields were scored per condition representative of 3 independent experiments. “*”s indicate statistical significance compared to fusion for CAN97–83 (A2) F after pH 5 pulses (n=3) [* p<0.05, ** p<0.005, *** p<0.0005 and **** p<0.0001]. Graph was broken into two experiments (denoted by the graph break and colors: red/orange bars represent independent experiment from green/blue). Statistical significance within these assays is compared to CAN97–83 within each independent experiment. (C) Luciferase reporter gene assay of Vero cells transfected with HMPV F upon which BSR cells were overlaid and subjected to two pH pulses. Data are presented and normalized to CAN97–83 (A2) F luminescence (fusion) at pH 5 (n = 3) +/− standard deviation. * Indicates statistical significance compared to CAN97–83 F after pH 5 pulses. Graphical representation and statistics were conducted as described in B. (D) Partial protein sequence analysis of F from 4 strains of HMPV surrounding key residues at positions 294 and 435. Sequence alignment was generated using ClustalW. The asterisk “*” indicates identical residues and the colon “:” indicates conserved substitutions.

