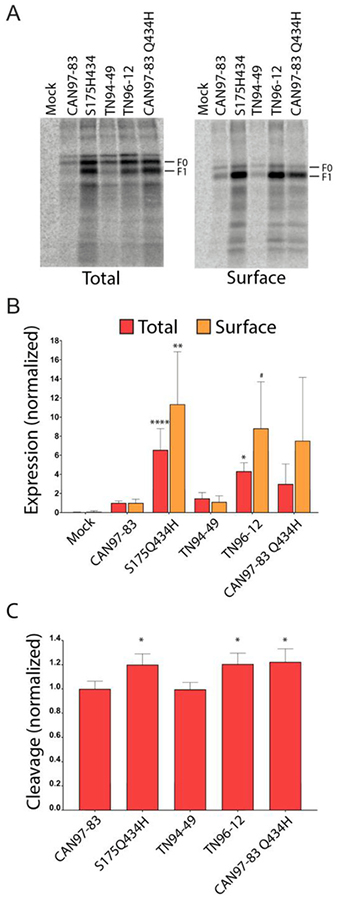
Fig 2. HMPV F protein expression and cleavage by exogenous trypsin.
(A) Representative gels of total and surface protein expression in metabolically labeled Vero cells expressing empty vector pCAGGS-MCS (Mock), CAN97–83 F, S175H434 F, TN94–49 F, TN96–12 F, and mutant CAN97–83 Q434H F in the presence of 3.0 μg/ml of TPCK-trypsin. (B) Quantification of the total and surface protein populations for F (F0 and F1 forms) in metabolically labeled Vero cells. Data are presented as normalization to CAN97–83 (A2) F expression, which was set to 1 (n = 4). “*”s Indicate statistical significance compared to F for CAN97–83 F (n= 4) [# P<0.07, * p<0.05, ** p<0.005, *** p<0.0005 and **** p<0.0001]. (C) Quantification of the relative amount of fusion protein cleavage within the surface population of F calculated using F1/(F1 + F0) and normalized to CAN97–83, set as 1.

