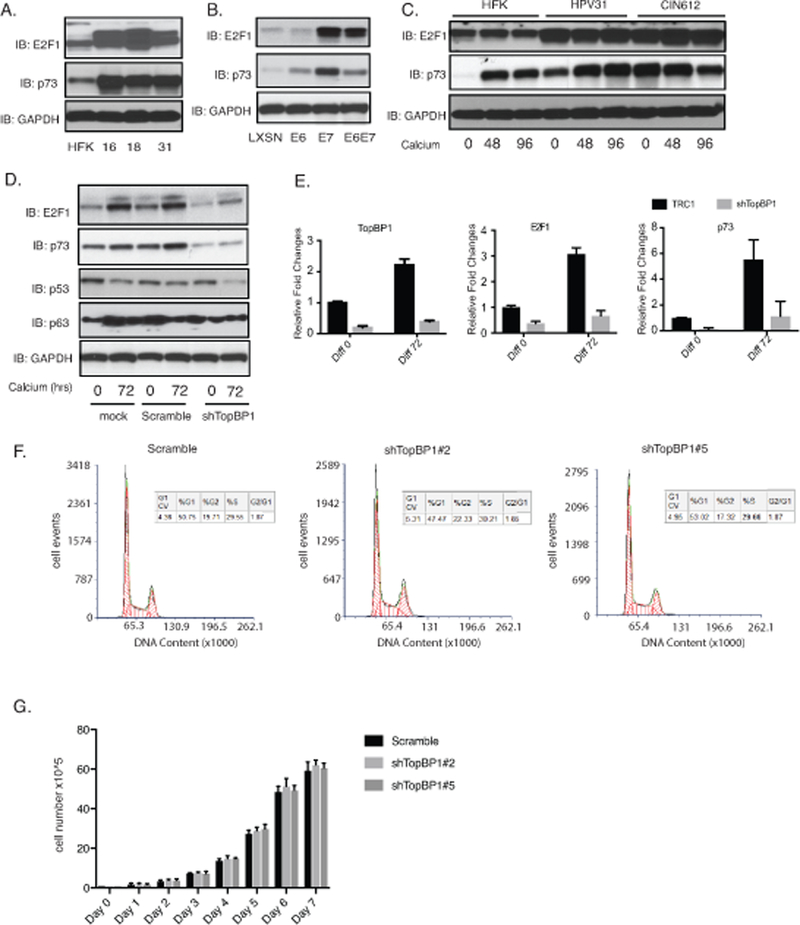
Figure 4.

TopBP1 activates expression of E2F1 and p73 in HPV positive cells. A). Western blot analysis of E2F1, p73 and GAPDH levels in HFK, HFK-16, HFK-18, and HFK-31 cells grown in monolayer cultures. B). Western blot analysis of E2F1, p73 and GAPDH levels in HFK cells stably infected with LXSN vector control or retroviruses expressing HPV31E6, HPV31E7, and HPV31E6E7. C) Western blot analysis of E2F1, p73 and GAPDH levels in in HFK, HFK-31 and HPV31-positive CIN612 cells differentiated in high calcium media for indicated times (hrs). D) Western blot analysis of E2F1, p73, p53, p63 and GAPDH levels in CIN612 cells stably infected with lentiviruses expressing shRNAs against TopBP1 following differentiation in high calcium media for indicated times (hrs). E) RT-PCR analysis of TopBP1, E2F1, and p73 levels in CIN612 cells with TopBP1 knockdown in high calcium media for indicated times (hrs). GAPDH was used as internal control and for normalization of the data. Data=mean +/− standard error. p-value <0.05. The experiments were repeated using two sets of TopBP1 shRNAs and only one was shown as a representative. F) The cell cycle distribution of the scramble CIN612 cells and the CIN612 cells with two different TopBP1 knockdown was measured by flow cytometry following propidium iodide staining. G) Comparison of the cell growth rates of CIN612 cells expressing scramble control or two different TopBP1 knockdown. All results are representative of observations from 2–3 independent experiments.
