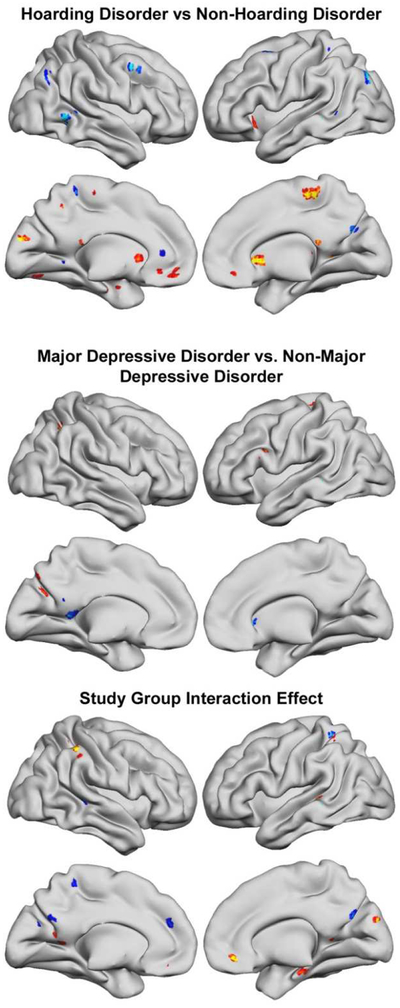
Figure 1.

For main effects of Hoarding or Major Depressive Disorder diagnosis (top and middle), red-yellow represents less functional connectivity in the each diagnostic group compared to participants without the diagnosis, while blue-scale represents more connectivity, as listed in Tables 1 and 2. For interaction effects (bottom), red-yellow and blue-scale colors were arbitrarily chosen to represent the negative and positive interaction effects of the two diagnostic groups (Table 3).
