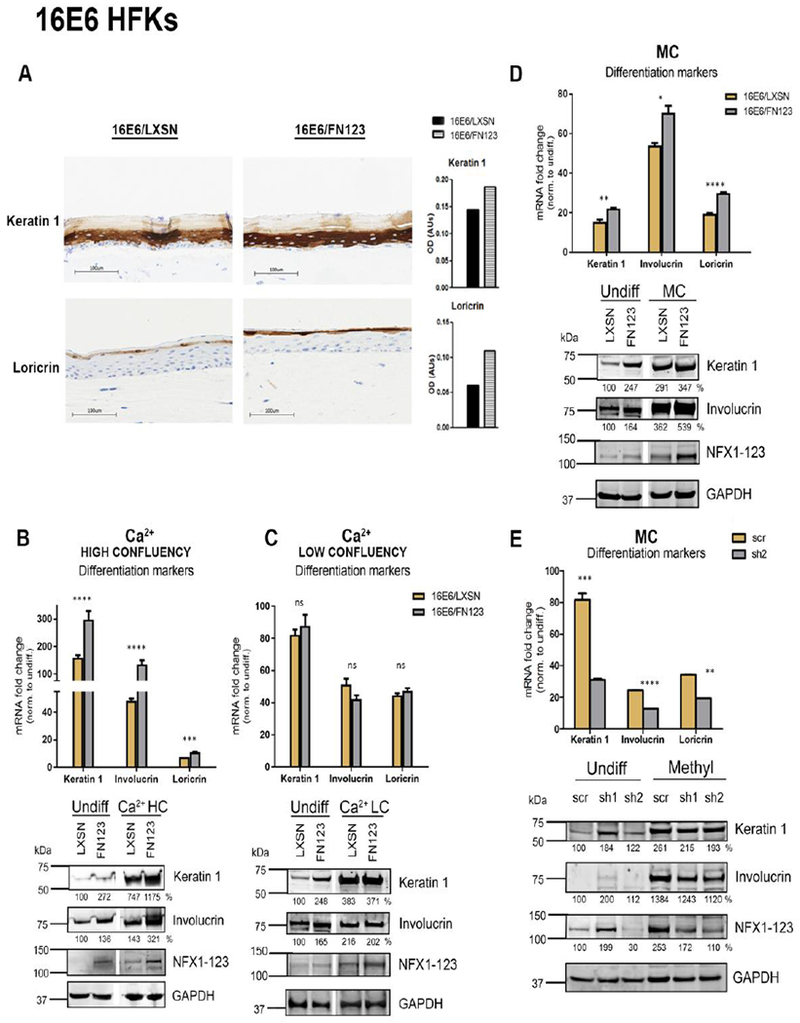
Fig 2. NFX1-123 regulates expression of differentiation markers in 16E6 HFKs.

(A) 16E6/LXSN and 16E6/FN123 raft cultures were stained for protein expression of differentiation markers Keratin 1 and Loricrin via immunohistochemistry. Total staining intensity for the section area was calculated in ImageJ. (B and C) 1×10⁶ 16E6/LXSN and 16E6/FN123 HFKs (B) or 3×10⁵ 16E6/LXSN and 16E6/FN123 HFKs (C) were plated and treated with 1.8mM Ca2+ for 0 or 72 hours, and total mRNA and protein collected. (D) 1×10⁶ 16E6/LXSN and 16E6/FN123 HFKs were suspended in methylcellulose (MC) for 0 or 24 hours, and total mRNA and protein collected. (B, C, and D) mRNA levels of Keratin 1, Involucrin, and Loricrin were measured by qPCR and compared to 16E6/LXSN 0 hours. Protein levels of Keratin 1, Involucrin, and NFX1-123 were assessed by Western blot. GAPDH was used as a loading control. Densitometry analysis was done in ImageJ. Protein levels were normalized to the loading control, and all samples compared to undifferentiated 16E6/LXSN. Statistical significance was calculated using unpaired t-tests. White spaces in Western blots indicate removal of empty or irrelevant lanes from original image for clarity. (E) 16E6 HFKs were transduced with short hairpins targeting NFX1-123 (sh1 and sh2) or scramble short hairpin control (scr). 1×10⁶ scr, sh1, and sh2 cells were suspended in methylcellulose (MC) for 0 or 24 hours, and total mRNA and protein collected. mRNA levels of Keratin 1, Involucrin, and Loricrin were measured by qPCR and compared to scr 0 hours. Statistical significance was calculated using one-way ANOVA with Bonferroni correction. Protein levels of Keratin 1, Involucrin, and NFX1-123 were assessed by Western blot. GAPDH was used as a loading control. Densitometry analysis was done in ImageJ. Protein levels were normalized to the loading control, and all samples compared to undifferentiated 16E6/scr. For B, C, D, and E, expression levels of genes of interest were normalized to the housekeeping gene GAPDH, and all error bars represent 95% confidence intervals from replicates. One representative experiment is shown from at least three conducted in biologically independent HFK cell lines. * p≤0.05, ** p≤0.01, *** p≤0.001, **** p≤0.0001
