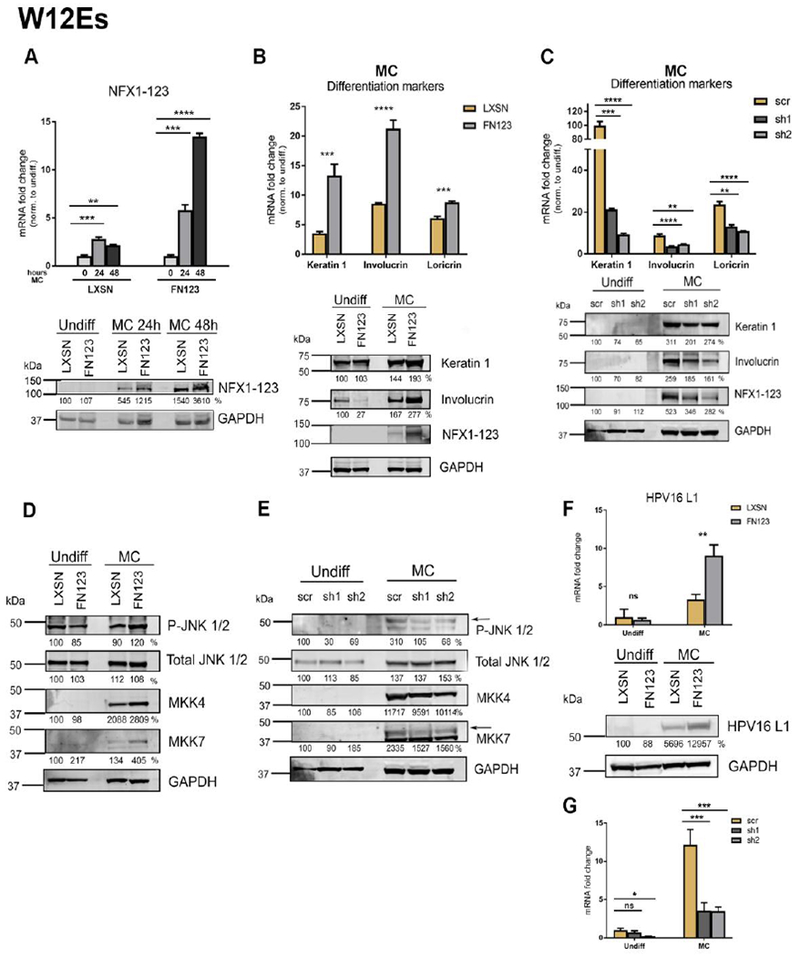
Fig 5. NFX1-123 mediates differentiation and L1 expression in HPV16-positive W12E cells.

(A) W12E cells were transduced with LXSN control vector (LXSN) or FLAG-tagged NFX1-123 overexpression construct (FN123) and 1×10⁶ cells were suspended in methylcellulose (MC) for 0, 24, or 48 hours. Mean expression of NFX1-123 mRNA measured by qPCR and compared to LXSN 0 hours. Protein levels of NFX1-123 were measured by Western blot using GAPDH as a loading control. (B) 1.5×10⁶ LXSN and FN123 W12E cells were suspended in methylcellulose (MC) for 24 hours and total mRNA and protein collected. mRNA levels of Keratin 1, Involucrin, and Loricrin were measured by qPCR and compared to W12E/LXSN 0 hours. Statistical significance was calculated using unpaired t-tests. Protein levels of Keratin 1, Involucrin, and NFX1-123 were assessed by Western blot. GAPDH was used as a loading control. Protein levels were normalized to the loading control, and all samples compared to undifferentiated LXSN. (C) W12E cells were transduced with a short hairpin targeting NFX1-123 (sh1 or sh2) or a scramble short hairpin control (scr), and 1.5×10⁶ cells differentiated by suspension in methylcellulose for 0 or 24 hours. mRNA expression of Keratin 1, Involucrin, and Loricrin was measured by qPCR and compared to scr 0 hours. Statistical significance was calculated using one-way ANOVA with Bonferroni correction and p values for the difference in means between scr and sh1 or sh2 are shown. Protein levels of Keratin 1, Involucrin, and NFX1-123 were measured by Western blot using GAPDH as a loading control. (D and E) Protein levels of P-JNK, total JNK, total ERK, total MKK4, and total MKK7 were assessed by Western blot in LXSN and FN123 W12E cells (D) or scr, sh1, and sh2 W12E cells (E). (F) mRNA expression levels of HPV16 L1 were measured by qPCR and compared to LXSN or scr W12E cells. Protein levels of L1 were assessed by Western blot in LXSN and FN123 W12E cells. (G) . For all qPCRs, expression levels of the genes of interest were normalized to the housekeeping gene GAPDH, and all error bars represent 95% confidence intervals from replicates. For all Western blots, protein levels were normalized to the loading control GAPDH, and all samples compared to the undifferentiated control (LXSN in 5A, B, D, F; or scr in 5C and E). Densitometry analysis was done in ImageJ. All experiments in Figure 5 were performed three independent times. * p≤0.05, ** p≤0.01, *** p≤0.001, **** p≤0.0001
