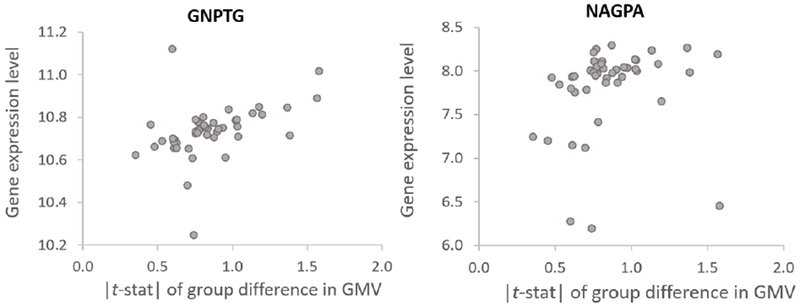
Figure 7.

Relationship between gene expression of two stuttering-linked genes (GNPTG and NAGPA) and absolute regional gray matter volume differences observed in persistent children who stutter. Dots represent brain regions in the left hemisphere defined by the AAL atlas. The brain regions with relatively high expression of GNPTG and NAGPA and between-group differences in GMV were primarily in the sensorimotor, parietal, the cingulate cortex, and the middle frontal gyrus. The Spearman’s rank correlation coefficients for gene expression-brain volume group difference were ρ = 0.57 for GNPTG, and ρ = 0.42 for NAGPA. Chow et al., 2018.
