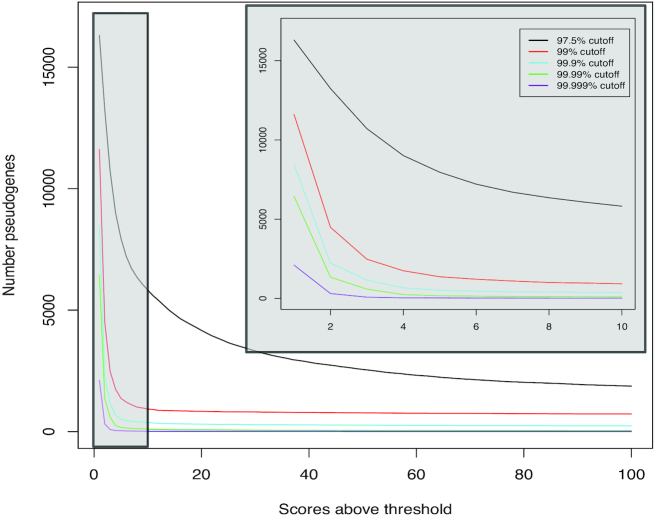
Figure 2:
The number pseudogenes that align to gene families. The x-axis is the number of gene families, which have an alignment score above a specified cutoff (the different colored lines). The y-axis is the number of pseudogenes with an alignment score higher than the cutoff to the number of gene families on the x-axis. The inset gray box is a closer view of the low-range gene family numbers (1–10) to show higher-resolution patterns.

