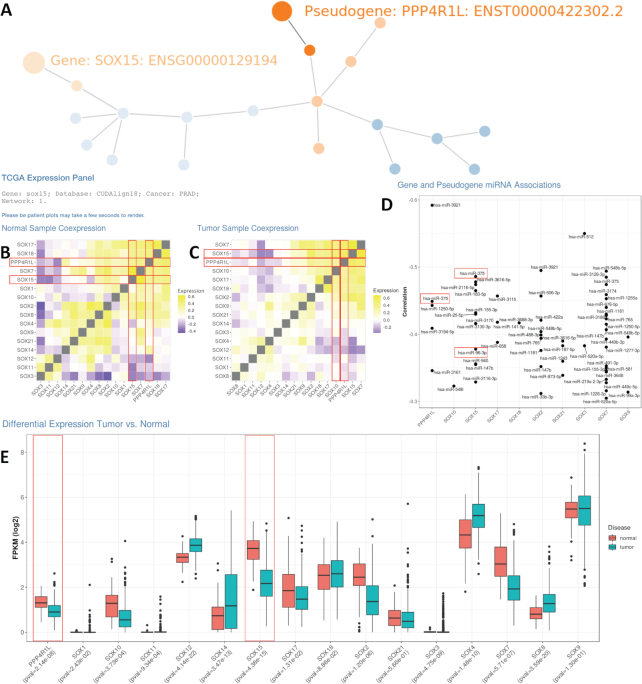
Figure 4:
PseudoFuN online output for SOX15 PGG family. A, Interactive graph visualization of the SOX15 PGG network. B, TCGA prostate co-expression matrix for SOX15 PGG family genes and pseudogenes across normal samples. C, TCGA prostate co-expression matrix for SOX15 PGG family genes and pseudogenes across tumor samples. D, Negatively correlated miRNAs for all members of the SOX15 PGG family. E, Differential gene and pseudogene expression for tumor and normal samples for each member of the SOX15 PGG family in the prostate cancer TCGA dataset. FPKM: fragments per kilobase million.

