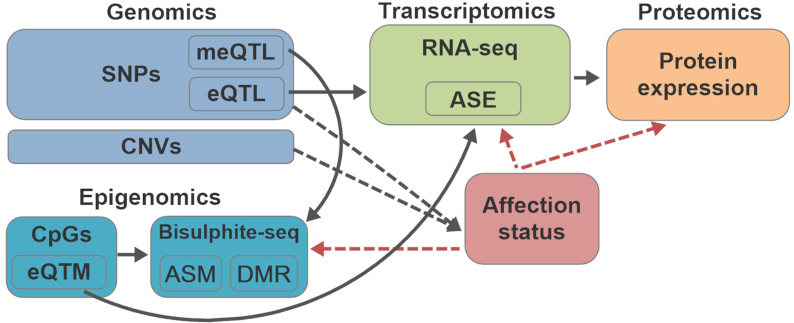
Figure 1:
Simulation framework of OmicsSIMLA. The black solid arrows represent the relationships among different types of omics data. The black dotted arrows represent the causal effects of genomics data to the disease. The red dotted arrows represent the retrospective simulations of the methylation, gene expression, and protein expression levels conditional on the disease status.

