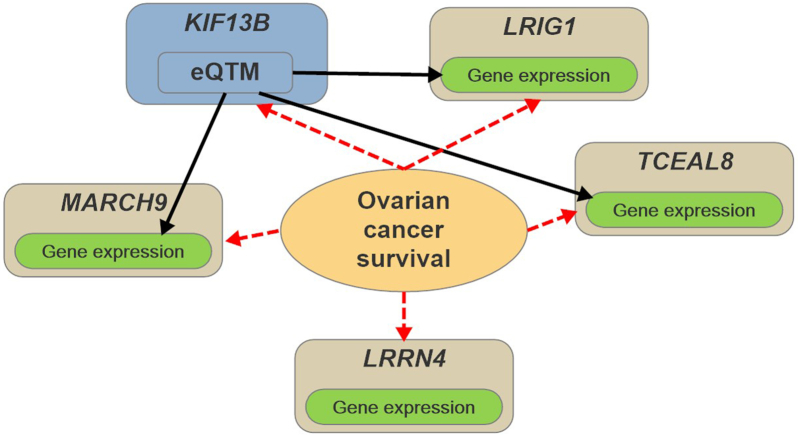
Figure 4:
Hypothetical model for the survival time (short-term and long-term) of OV. The black solid arrows represent the regulatory effects of the eQTM on gene expression. The red dotted arrows represent the retrospective simulations of the methylation and gene expression levels conditional on the survival status.

