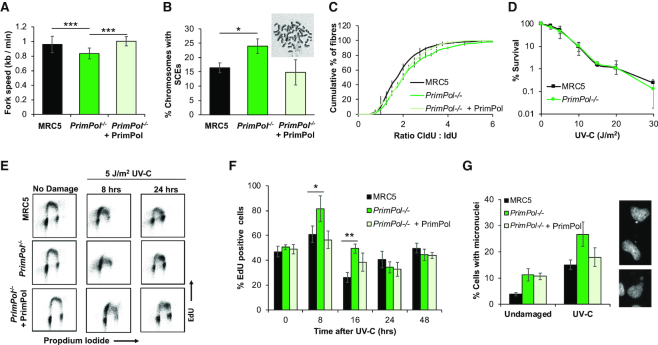
Figure 2.
PrimPol−/− cells have decreased replication speeds, increased damage recovery times and micronuclei. (A) Replication fork speeds were measured in WT and PrimPol−/− cells or PrimPol−/− complemented with GFP-PrimPol by labelling forks with CldU, followed by IdU and measuring individual fibres after spreading. 300 fibres were measured over 3 independent experiments. P values were 2.06 × 10⁻¹⁰ for MRC5:PrimPol−/−, 0.236 for MRC5:PrimPol−/− + PrimPol and 1.24 × 10⁻¹⁴ for PrimPol−/−:PrimPol−/−+ PrimPol. (B) Percentage of chromosomes carrying one or more sister chromatid exchanges (SCEs) were counted. Data represents three independent experiments, where 200+ chromosomes were analysed per slide. Error bars show standard deviation and a representative image of WT cells is shown above. (C) This figure shows the accumulated percentage of ratios of the two labels, where a pulse of 20 J/m2 UV-C was given in between the two labels. Data is shown as the average across three independent experiments (∼300 fibres) with error bars representing standard deviation. Student's t-test on this data showed P values of 0.0000106 for MRC5: PrimPol−/− (*** significance), 0.09 for MRC5: PrimPol−/− + PrimPol (not significantly different) and 0.0024 for PrimPol−/− + PrimPol (** significance). (D) Colony survival assays were used to compare the sensitivity of cells to UV-C damage, chart represents n ≥ 3 independent repeats with error bars showing standard deviation. (E) WT and PrimPol−/− cells or PrimPol−/− complemented with GFP-PrimPol were labelled with EdU at increasing time points after 5 J/m2 UV-C damage. After being fixed and dual labelled with propidium iodide, cells were analysed by flow cytometry. (F) This shows the percentage of EdU positive cells in early S-phase at increasing times after damage n ≥ 3, error bars show standard deviation. (G) Cells were stained with DAPI 72 h after 0 or 5 J/m2 UV-C damage and number of cells with one or more micronucleus were counted as a percentage of the total cell population, charts show the mean of three or more independent experiments with standard deviation shown by error bars. Representative images are shown on the right. Significance was measured using a Student's t-test, * P≤ 0.05, ** P≤ 0.01, *** P≤ 0.001.

