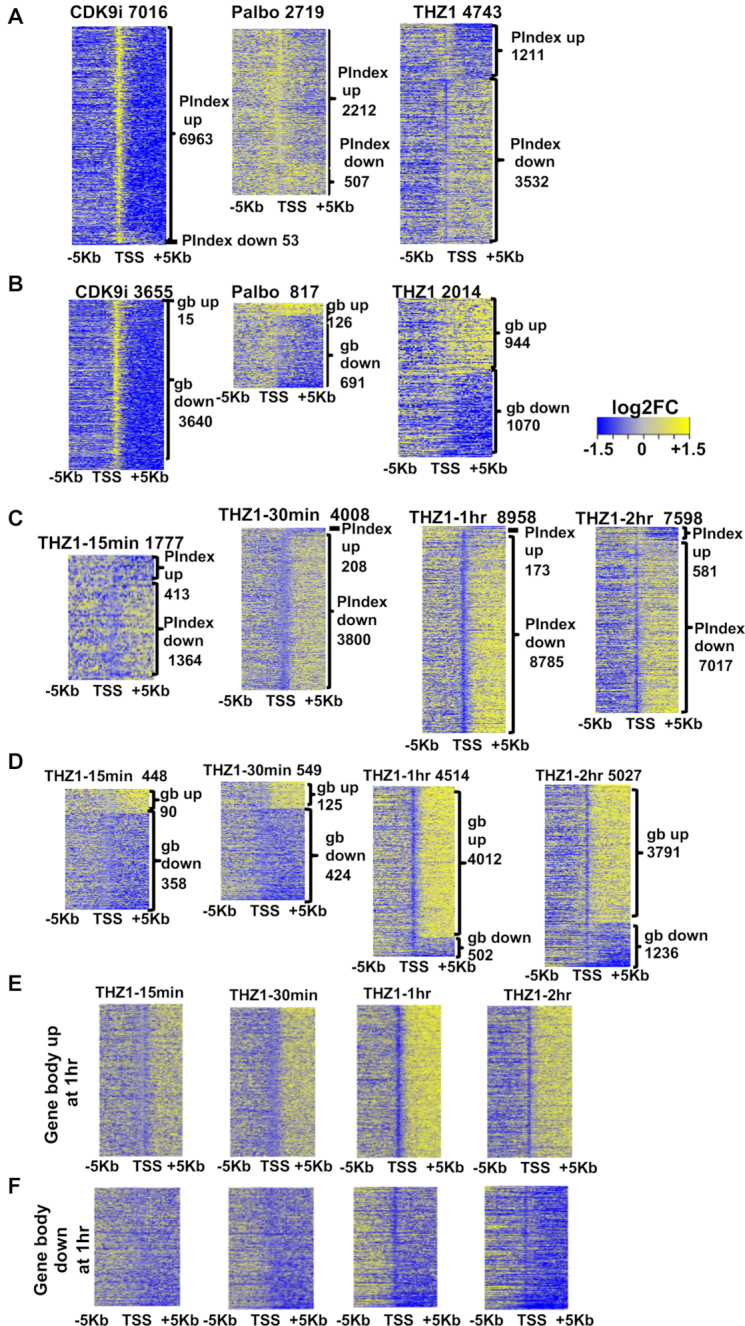
Figure 3.

CDKi affect promoter-proximal RNA polymerase pausing. (A) log2 transformed fold change (log2FC) values for the affected genes are ranked according to the pausing indices (log2FC). Then log2FC PROseq read counts in 200 bp bins ± 5 kb around the TSS for these genes from each indicated drug were depicted as heatmaps. The labels on the top indicated the drug used and the number of refseq genes in the heatmap. CDK9i represent the common genes affected by all the three CDK9 inhibitors (FVP, Dina and PHA). The labels on the side indicate the number of genes that gained or lost pausing of RNA polymerase II at promotor-proximal regions (P.Index). (B) Similar strategy as in (A) was employed in drawing the heatmaps but the genes were ranked according to the (log2FC) of gene body read counts from PROseq. The numbers on the side represent the number of the refseq genes that gained or lost polymerase in the gene body. (C) Time course of THZ1 treatment. log2FC of PROseq read counts in 200 bp bins ± 5 kb of the TSSs for the THZ1 affected genes from each indicated time-point of the time course experiment (15 min, 30 min, 1 h and 2 h with THZ1 treatment at 400 nM). Genes are ranked based log2 transformed fold change values (log2FC) of pausing index. (D) heatmaps of genes ranked according to the log2FC of gene body read counts using similar strategy as in A. the log2FC of read counts in 200 bp bins ± 5 kb of the TSS for the genes that either increased gene body polymerase density (E) or decreased gene body polymerase density (F) at 1 h post treatment. These same genes were then plotted from each of the indicated time-point as heatmaps ± 5 kb from the TSS (up-regulated 4012 genes; down-regulated 502 genes, from D).
