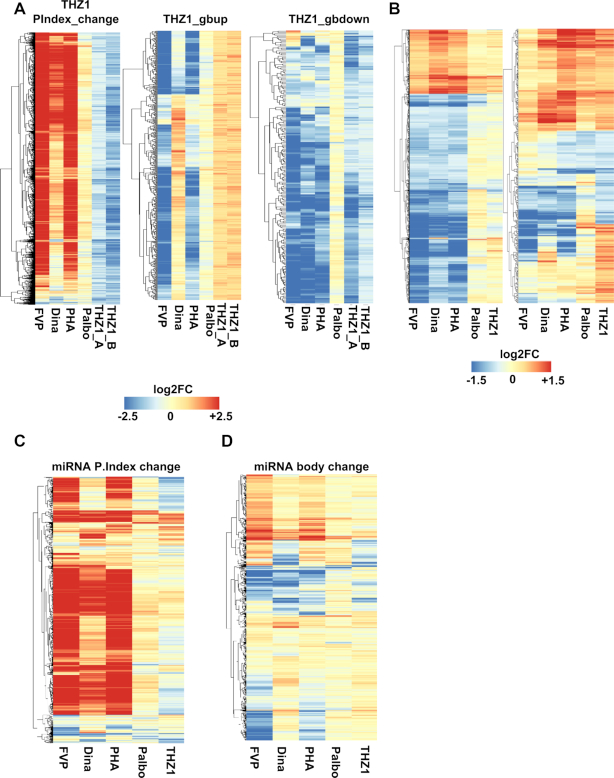
Figure 4.
Unsupervised clustering analysis on genes affected by CDK Inhibitors. (A) Unsupervised clustering analysis on commonly overlapped genes that lost promoter proximal pausing after 1 h THZ1 treatment (Figure 3A) and 1 h time-point from the THZ1 time course experiment (Figure 3C) in comparison to the other CDK inhibitor treatments based on the pausing index change (PIndex change, left panel). Similar analysis was performed on genes that either increased polymerase density in the gene body or vice versa after THZ1 treatment. (B) Left panel: unsupervised clustering analysis of the commonly overlapped, differentially expressed genes from the RNAseq data for 1 h CDK9i (FVP, Dina and PHA) treated samples as compared to palbociclib or THZ1 treated samples processed at the same time as the PROseq samples. Right panel: unsupervised clustering analysis of the differentially expressed genes from the RNAseq data for 1 h THZ1 treated samples. The expression of these genes is then shown after a 1 h treatment with the other inhibitors. (C) log2 transformed fold change values of pri-miRNA expression relative to DMSO are shown as heatmaps for the pri-miRNAs affected by the CDKi ranked according to the pausing indices (C) and pri-miRNA gene body (D).

