Figure 6.

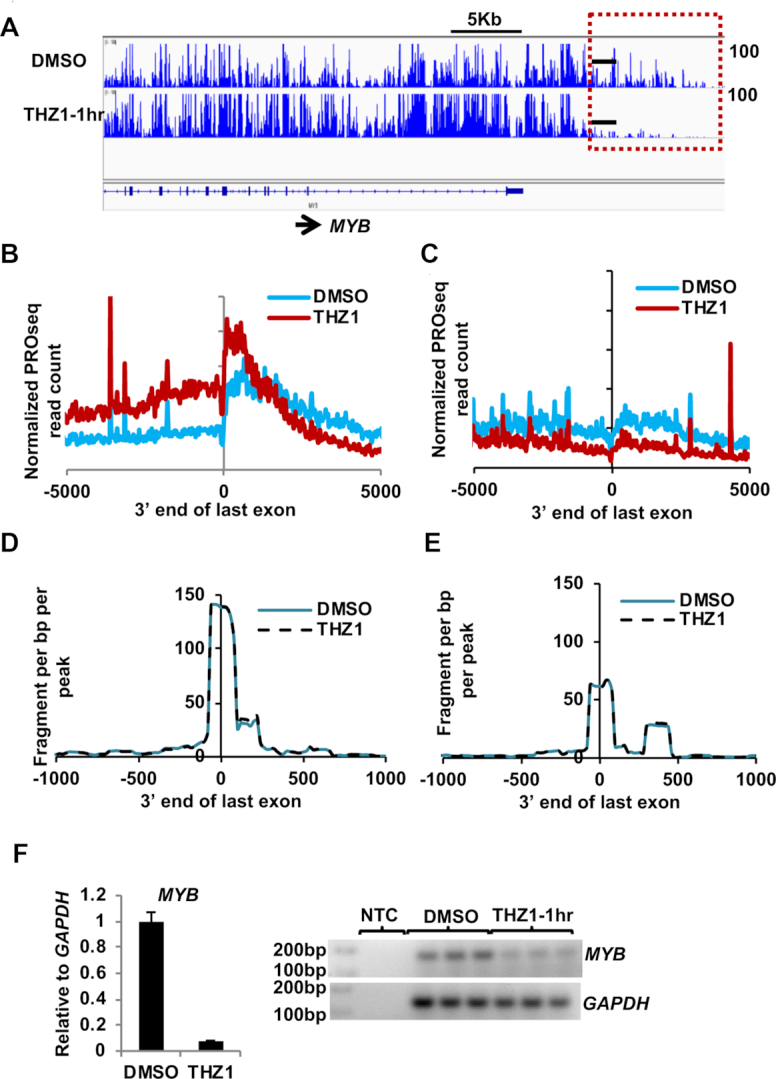
THZ1 affects transcription at the 3′ end from the last exon. (A) PROseq IGV browser screenshot of genome tracks for MYB after 1 h of THZ1 treatment. Red dashed box highlights the region 3′ to the last exon and black bars indicate the region where primers were designed for the qRT-PCR. (B, C) Metaplots of normalized PRO-seq read signal for THZ1 treated samples at 1 h was plotted ±5 kb of the last exon divided into 20 bp bins for the genes with increased gene body density from Figure 3B, 944 genes (third panel), or genes with decreased gene body density from Figure 3B, 1070 genes (third panel). (D, E) Metaplots of normalized PolyA-seq read signal for THZ1 treated samples at 1 h was plotted ±1 kb from the last exondivided into 20 bp bins for the above mentioned genes in (C). (F) Graph of qRT-PCR of the effected region (n = 3) from MYB shows decreased read through transcript levels after 1 h treatment with THZ1. The representative gel image shows the qRT-PCR endpoint for technical replicates from one qRT-PCR experiment.
