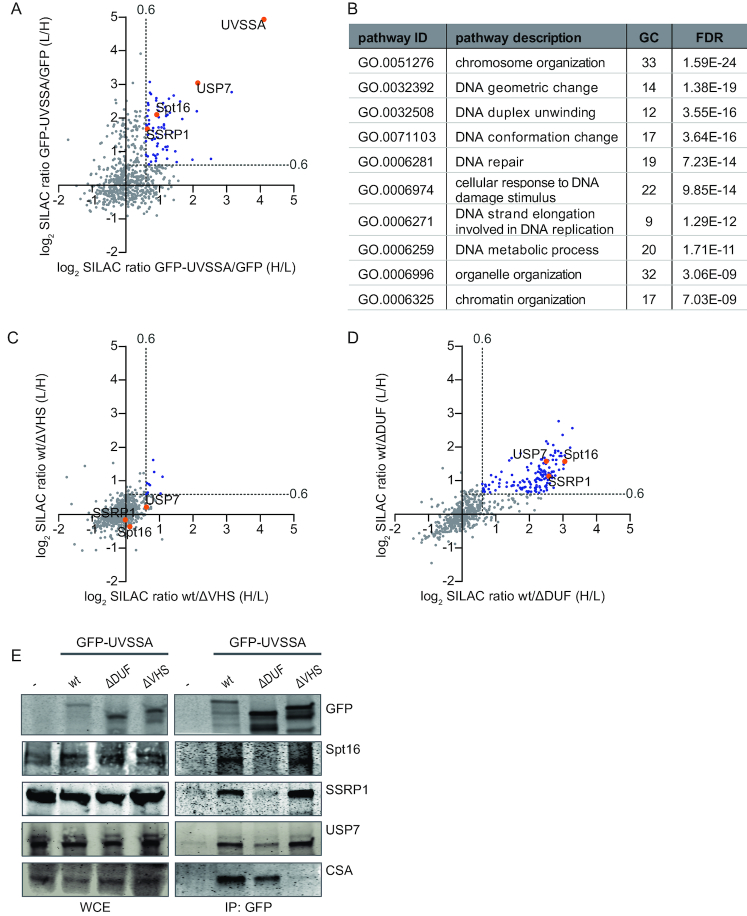
Figure 3.
Quantitative interaction proteomics reveal UVSSA interaction partners and required UVSSA-domains. (A) Scatter plot of log2 SILAC ratios of proteins isolated by GFP-pulldown in UVSS-A cells stably expressing either GFP-UVSSA or GFP (non-specific binding control). The experiment was conducted in duplicate with a label swap. The log2 SILAC ratios of proteins identified in the forward experiment (GFP-UVSSA versus GFP, H/L, x-axis) are plotted against the log2 SILAC ratios of proteins identified in the reversed experiment (GFP-UVSSA versus GFP, L/H, y-axis). Proteins were classified as specific UVSSA interactors (marked in blue) when log2 SILAC ratio >0.6 (indicated by gray dotted line) in both replicates. (B) GO-term analysis of the 66 proteins identified as specific interactors of UVSSA. A selection of the top 10 enriched biological process pathways is shown. GC: gene count; FDR: false discovery rate. (C) Scatter plot of log2 SILAC ratios of proteins identified in the GFP-pulldowns of wt UVSSA versus ΔVHS, only proteins that were also identified in the GFP-UVSSA versus GFP proteomics experiment are depicted. The experiment was conducted in duplicate, including a label swap. The log2 SILAC ratios of proteins identified in the forward experiment (wt versus ΔVHS, H/L, x-axis) are plotted against the log2 SILAC ratio of proteins identified in the reversed experiment (wt versus ΔVHS, L/H, y-axis). The majority of proteins have similar binding ability to the ΔVHS mutant compared to the wt (log2 SILAC ratio <0.6, proteins marked in gray). Proteins marked in blue represent proteins whose interaction with UVSSA is decreased in the absence of the VHS domain. (D) Scatter plot of log2 SILAC ratios of proteins identified in the GFP-pulldowns of wt UVSSA versus ΔDUF only proteins that were also identified in the GFP-UVSSA versus GFP proteomics experiment are depicted. The experiment was conducted in duplicate, including a label swap. The log2 SILAC ratios of proteins identified in the forward experiment (wt versus ΔDUF, H/L, x-axis) are plotted against the log2 SILAC ratio of proteins identified in the reversed experiment (wt versus ΔDUF, L/H, y-axis). Proteins marked in blue have a reduced interaction with UVSSAΔDUF compared to wt (proteins are marked in blue, log2 SILAC ratio >0.6, gray dotted line marks the threshold). (E) Cross-linked nuclear extracts of UVSS-A patient cell line (TA24), stably expressing the indicated constructs were subjected to GFP immunoprecipitation. Non-complemented UVSS-A patient cell line (-) was used as negative binding control. WCE: whole-cell extract, IP: Immunoprecipitation. Western blot analysis of the co-immunoprecipitated proteins was performed for GFP, Spt16, SSRP1, USP7 and CSA.

