Figure 4.
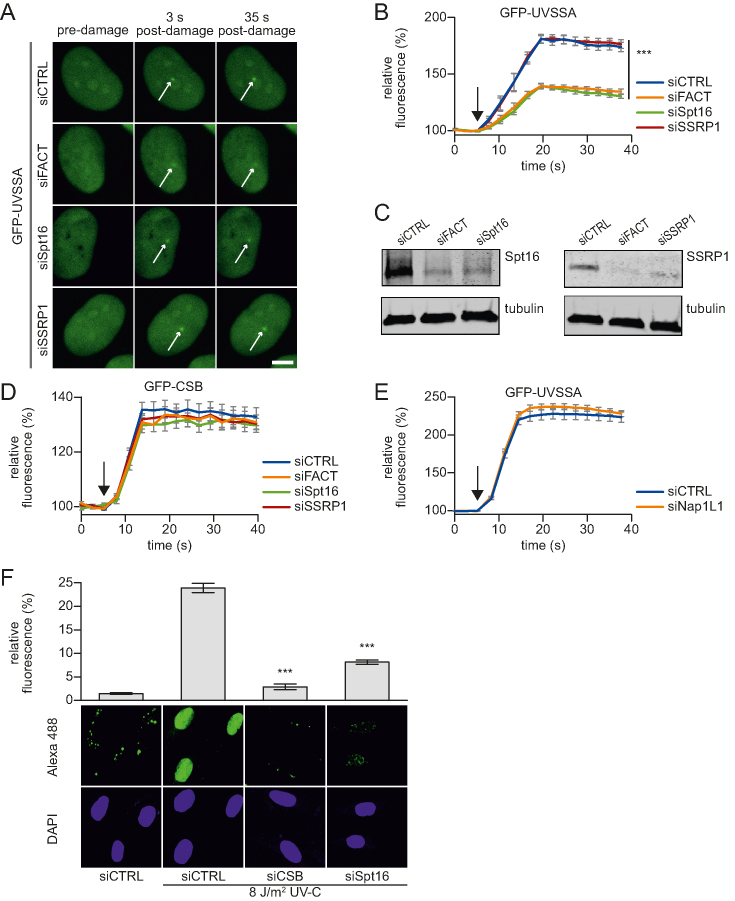
Spt16 mediates UVSSA accumulation on UV-C induced DNA damage. (A) Representative images of live-cell imaging analysis of GFP-UVSSA expressing cells transfected with the indicated siRNAs (CTRL is a non-targeting siRNA), following local UV-C laser (266 nm) induced damage (indicated by a white arrow); scale bar: 7.5 μm. (B) Relative GFP-UVSSA accumulation at sites of LUD in cells transfected with the indicated siRNA. GFP fluorescence intensity at LUD was measured over time using live-cell confocal imaging and normalized to pre-damage intensity set at 100 at t = 0 (n = 30 cells of two independent, pooled experiments, mean ± SEM). A one-way Anova test was performed and P-values <0.001 (***) are depicted. The moment of damage induction is indicated with a black arrow. (C) siRNA transfected cells as used in the live-cell imaging experiments (A and B) were lysed directly after the experiment. Lysates were analyzed by western blot with the indicated antibodies. Tubulin was used as loading control. (D) Relative GFP-CSB accumulation in CS-B (CS1AN) cells at sites of LUD in cells transfected with the indicated siRNA. GFP fluorescence intensity at LUD was measured over time using live-cell confocal imaging and normalized to pre-damage intensity set at 100 at t = 0 (n > 25 cells of two independent experiments, mean ± SEM). The black arrow indicated the moment of damage induction. Representative images are shown in Supplementary Figure S3E. (E) Relative GFP-UVSSA accumulation at sites of LUD in control and NAP1L1 depleted cells. Representative images and knock down efficacy are shown in Supplementary Figure S3F and G, respectively. GFP fluorescence intensity at LUD was measured over time using live-cell confocal imaging and normalized to pre-damage intensity set at 100 at t = 0 (n > 30 cells, two independent experiments, mean ± SEM). The black arrow indicates the moment of damage induction. (F) XP186LV patient cells (XP-C; GG-NER-deficient) were transfected with non-targeting control (CTRL) siRNA and siRNA against CSB and Spt16. Cells were irradiated with UV-C (8 J/m2) or mock-treated as indicated, and subsequently labelled for 7 h with EdU. The efficacy of the gap-filling synthesis was assessed by measuring the fluorescently labeled, incorporated EdU into the DNA. Amplified UDS signals were quantified (upper panel) by confocal microscopy measurement of the total nuclear fluorescence (Alexa-Fluor 488 nm, n > 170 cells for each condition, two independent experiments, mean ± SEM) and representative images (lower panel) are shown. A two-tailed t-test was performed and P-values < 0.001 (***) are depicted.

