Figure 2.
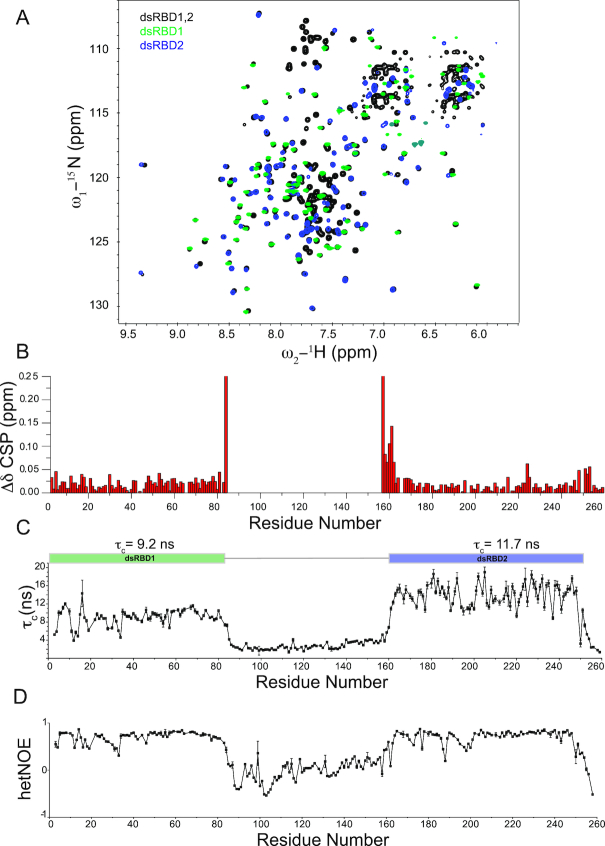
(A) 1H,15N-HSQC NMR spectrum of dsRBD1,2 (black), dsRBD1 (green) and dsRBD2 (blue) are shown. No major chemical shift differences between the three spectra could be observed suggesting that the two domains act as independent modules in solution. (B) Chemical shift perturbations in dsRBD1,2 compared to individual domains. Residues located at the C-terminus of dsRBD1 and the N-terminus of dsRBD2 are the only ones which exhibit chemical shift differences, but this derives from being the terminal residues in case of individual domains and being connected to the linker in context of the dsRBD1,2 construct. (C) Rotational correlation times (τc) for individual residues as calculated from the ratio of 15N R2/R1 relaxation rates are shown. Average τc for each individual domain is shown on top of the graph. Error bars are calculated from duplicate relaxation delays (see methods). (D) {1H}–15N heteronuclear NOE values for the MLE-dsRBD1,2. Both graphs visualize the different dynamics of the linker region compared to the domain regions. The linker region is highly dynamic.

