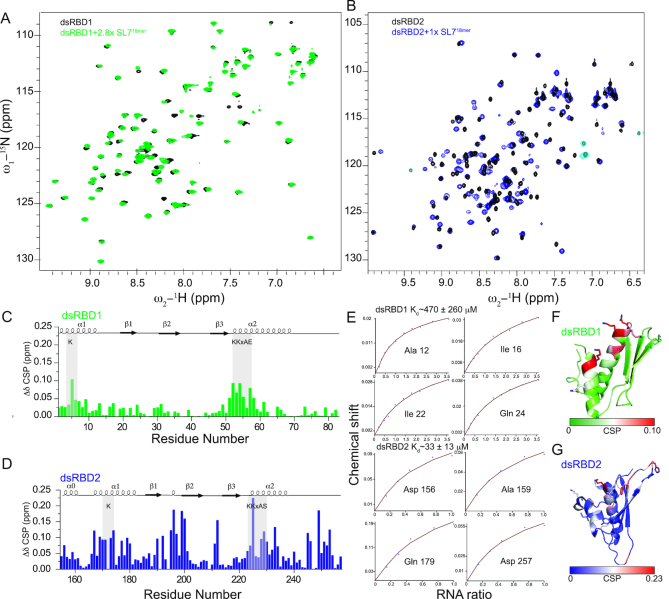
Figure 4.
(A, B) Superposition of 1H, 15N HSQC NMR spectra of individual dsRBD1 and dsRBD2 domains free and bound to SL718mer. Only the final titration point is shown here for clarity (see Supplementary Figure S4 for all titration points). (C, D) Chemical shift perturbations upon titration with saturating concentrations of SL718mer in dsRBD1 and dsRBD2 respectively. (E) Fitted NMR titration curves are shown along with the affinity calculated from the average of peaks showing fast exchange. Errors were calculated by error propagation of fitting error for individual peaks used for affinity calculation. (F, G) Mapping of chemical shift perturbations on the NMR structure of dsRBD1 and dsRBD2, respectively.

