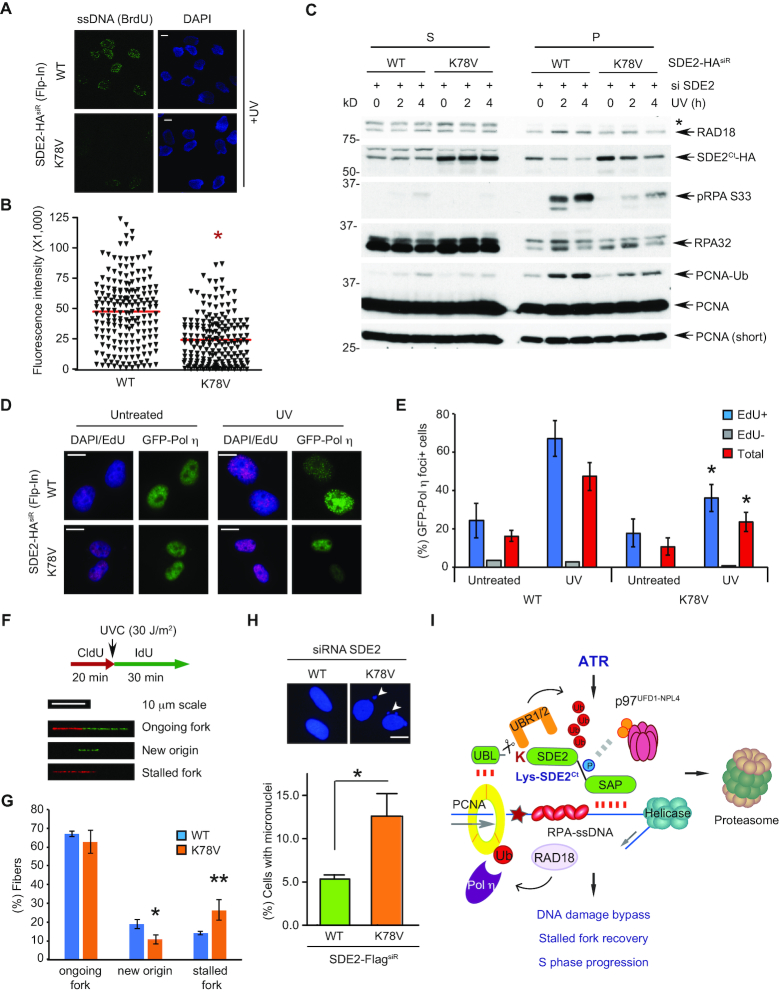
Figure 6.
UVC-induced SDE2Ct degradation promotes DNA damage bypass at stalled replication forks. (A) SDE2 WT or K78V flipped cells were incubated with 10 μM BrdU for 48 h, and ssDNA presence was analyzed by anti-BrdU immunostaining in non-denaturing conditions. Representative images are shown. Scale bar, 10 μm. (B) Quantification of BrdU intensity using Fiji. A representative result from three independent experiments is shown. * P < 0.0001, unpaired Student's t-test. (C) SDE2 WT or K78V flipped cells were irradiated with 40 J/m2 UVC and harvested 4 h later, then fractionated and analyzed by WB. * ubiquitinated RAD18 at S. (D) WT or K78V flipped cells were reverse transfected with GFP-Pol η on coverslips, pretreated with 10 μM EdU for 30 min to mark S-phase cells, irradiated with 40 J/m2 UVC, and after 2 h, GFP-Pol η foci were visualized by anti-GFP immunofluorescence. Representative images of GFP-Pol η from EdU+ cells (Alexa Fluor 647; violet) are shown. Scale bars, 10 μm. (E) Quantification of GFP-Pol η foci from EdU+, EdU–, or total (both EdU+ and EdU-) cells. Foci+ indicates >20 defined GFP-Pol η foci. Mean ± SD (n = 3), >100 cells per condition. * P < 0.01 compared to WT, unpaired Student's t-test. (F) Experimental conditions for DNA combing and representative images of DNA fiber tracks as classified. (G) Quantification of ongoing forks, IdU-labeled only (new origin firing), and CldU-labeled only (stalled fork) tracks. Mean ± SD (n = 3), >100 tracks per condition. * P = 0.0154 ** P = 0.0210, unpaired Student's t-test. (H) SDE2-FlagsiR WT or K78V-expressing U2OS cells were DAPI-stained, and the percentage of nuclei exhibiting micronuclei (arrowhead) were quantified. Mean ± SEM (n = 3), * P = 0.0102, unpaired Student's t-test. Scale bars, 10 μm. (I) A model depicting the ATR-N-end rule-p97 signaling axis that regulates SDE2Ct degradation after UVC damage.

