Figure 4.
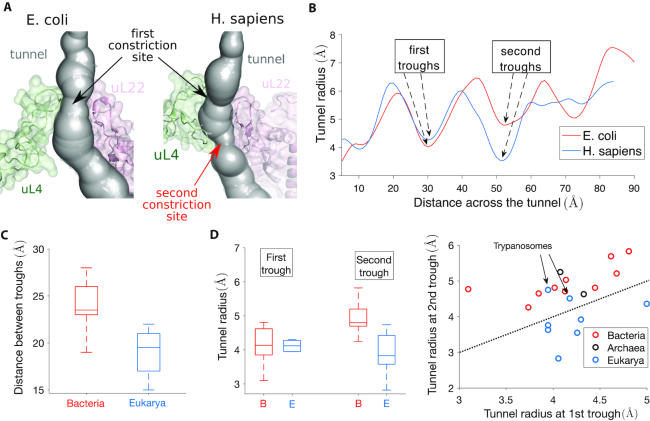
The presence of a second constriction site in eukarya explains the geometric difference observed between bacterial and eukaryotic tunnels. (A) We show the constriction site region in E. coli (left) obtained from Fischer et al. (85), and H. Sapiens (right) obtained from Natchiar et al. (94). The structure is surrounded by ribosomal proteins uL4 and uL22. An extended arm in H. sapiens uL4 produces a second constriction site (see also Supplementary Figure S4). (B) The plots of the tunnel radius as a function of the tunnel distance shows a first trough associated with the constriction site (around position 30), common to E. coli and H. sapiens. A second trough appears around position 50. (C) We compare the distance between the troughs for bacteria (left box plot) and eukarya (right box plot) in our dataset. The interquartile range is indicated by the box, the median by a line inside, and upper and lower adjacent values by whiskers. (D) In left, we provide the same comparison as in (C) for the tunnel radii associated with the first and second troughs. In right, we compare the radius of the first and second troughs for each species of our dataset. The second trough radius is larger than the first one for all archaea (black dots) and bacteria (red dots). In contrast, this is only the case in eukarya for trypanosome species L. donovani and T. cruzi.

