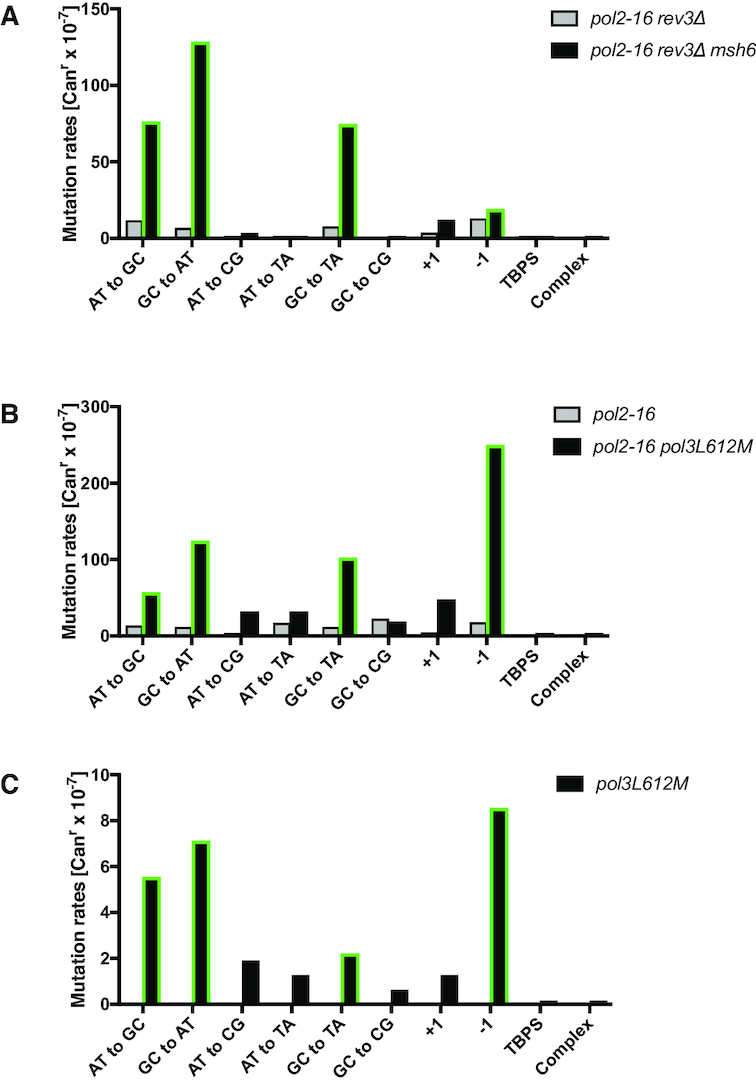
Figure 3.

Pol δ is responsible for a fraction of mutations in the pol2-16 mutant. Data in diagrams A–C are from Table 2 and show the mutation rates of specific mutation classes measured for pol2-16 rev3Δ, pol2-16 rev3Δ msh6Δ (panel A), pol2-16, pol2-16 pol3L612M (panel B) and pol3L612M yeast (panel C). Grey and black bars represent different genotypes. Green borderline of bars indicates mutation classes characteristic for L612M Pol δ.
