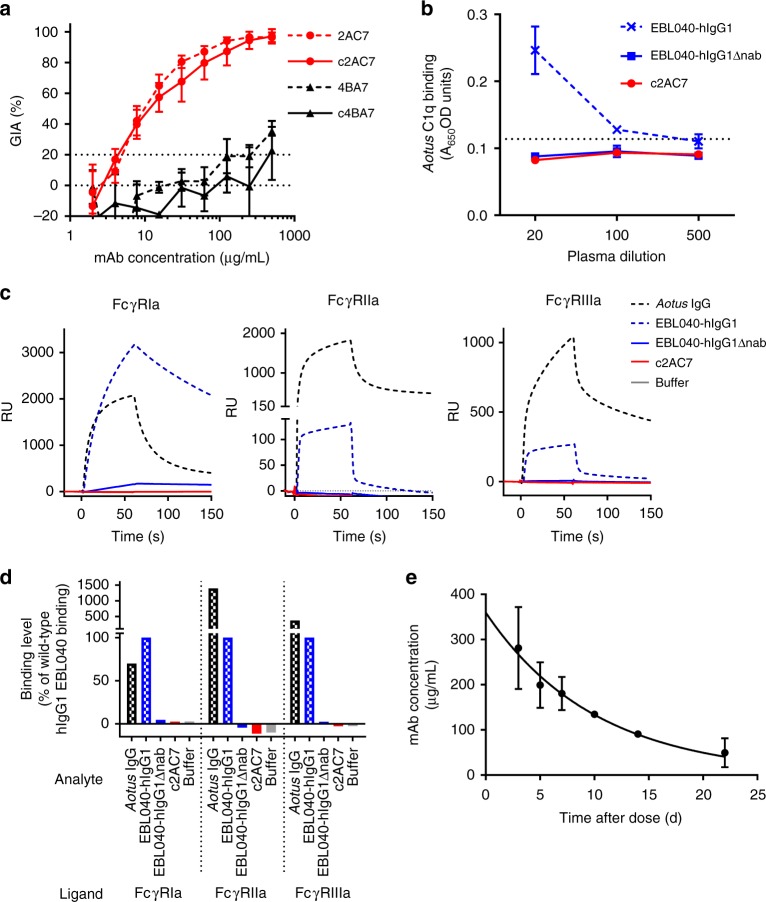
Fig. 1.
Chimeric mAbs have desired properties for a challenge study. Panel a shows GIA with murine (dashed lines) and chimeric (solid lines) versions of 2AC7 (red lines) and 4BA7 (black lines) against FVO-strain parasites. Error bars indicate range of two independent experiments (with each experiment’s datum being the mean of three replicate wells); lines connect the mean of the experiments. Results of −20 to 20% GIA are regarded as negative. Panel b shows absence of ELISA-detectable interaction of A. nancymaae C1q with mAbs bearing the hIgG1Δnab Fc. Horizontal dotted line indicates background (mean plus two standard deviations of control wells coated with mAbs but not receiving plasma); points and error bars indicate mean and range of two replicate wells per condition. Panels c and d show SPR data demonstrating that the hIgG1Δnab Fc abrogates binding to A. nancymaae Fcγ receptors. Panel c shows reference-subtracted (Fc2-1) binding-response curves for the injection of various antibody analytes (indicated by line characteristics, as shown in the legend to the right) over chips with FcγRIa (left), FcγRIIa (middle), and FcγRIIIa (right) ligands captured on Fc2; in each case, analyte is injected from 0 to 60 s. Panel d summarizes peak (60 s) binding of each antibody to each receptor, expressed as percentage of the response obtained on the same receptor with the wild-type human IgG1 mAb control (EBL040-hIgG1). Panel e shows results of preliminary pharmacokinetic study: anti-PfRH5 ELISA-measured plasma mAb concentrations from days 3 to 22 after administration of a single dose of 30 mg/kg c4BA7 to two A. nancymaae. Points are mean of two animals’ results; error bars show the range, although are not visible where replicates were in close agreement. Line shown is the fitted one-phase exponential decay curve

