
Figure 1.
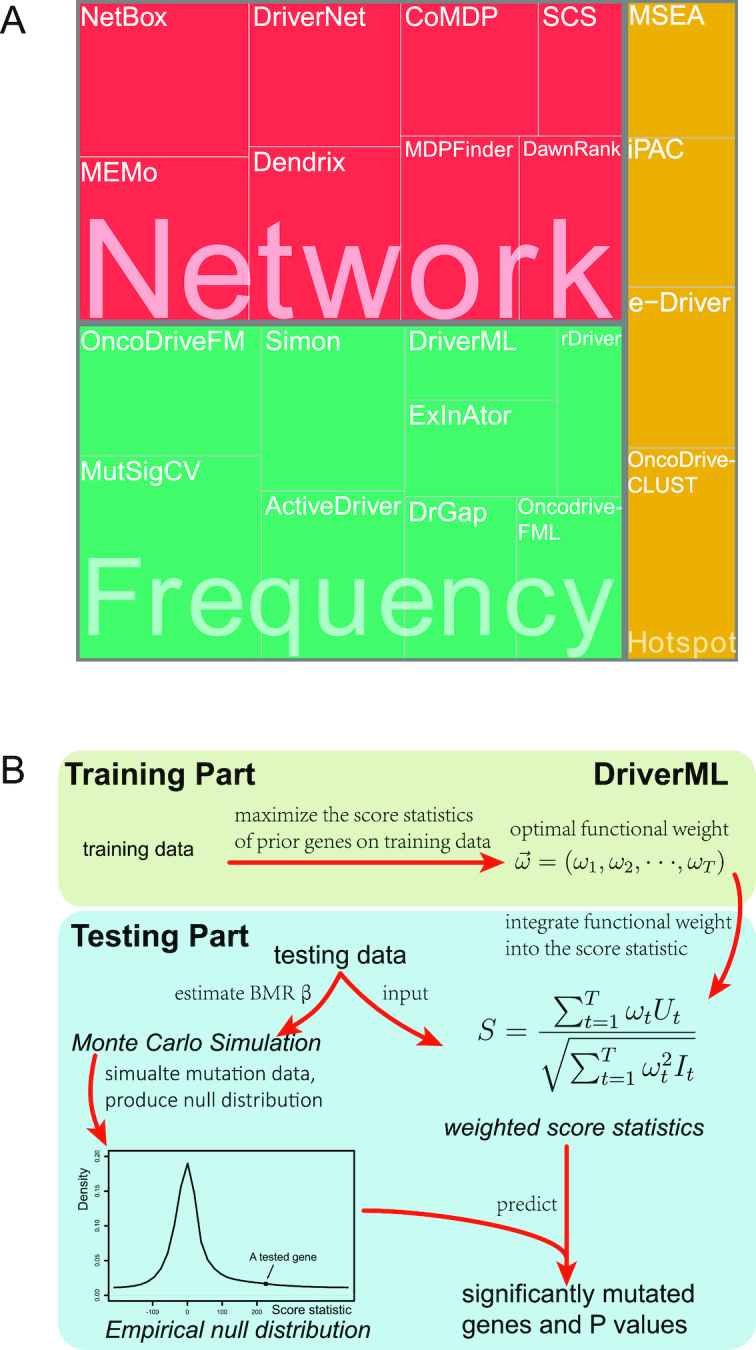
Computational tools for identifying cancer driver genes. (A) Classification of 21 driver gene prediction tools evaluated in this study. These widely used tools are classified as frequency-based, hotspot-based and network-based methods. The block size for each tool represents its citation times according to data obtained from the Web Of Science on 27 September 2018 (the larger block size, the more the citation times). MutSigCV is a widely used tool that is the most frequently cited in the literature. It has the largest block size. Two up-to-date tools, rDriver and SCS (published in 2018), along with DriverML, had no citation, and had the smallest block size. (B) Summary of the main workflow of DriverML. DriverML identifies cancer driver genes by combining a weighted score test and machine learning approach. The weights ( , T represents the total number of mutation types evaluated in this study) in the score statistics quantify the functional impacts of different mutation types on the protein. To assign optimal weights to different types of non-silent mutations, the score statistics of prior driver genes were maximized in pan-cancer training data based on the machine learning approach. The U and I represent the Rao score function and Fish information, respectively. To test cancer driver genes, the score value of each gene was computed with the weighted score statistic with the learned weight parameters. The empirical null distribution of score statistics, from which P-values of tested genes were calculated, was generated by Monte Carlo simulation.