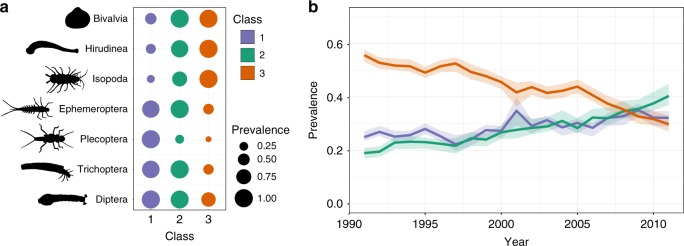
Fig. 1.
Macroinvertebrate community composition and change across England and Wales 1991–2011. a Characteristic changes in the community among the three biological classes: the mean prevalence of families within the seven higher taxa showing the greatest change among classes, scaled so that the relative prevalence of each taxon = 1 in the class where it was most prevalent, and b the change in prevalence of the three classes, with bootstrapped 95% confidence limits. See Supplementary Fig. 4a for a full version of a. Source data are provided as a Source Data file. Invertebrate silhouettes drawn by I. Vaughan

