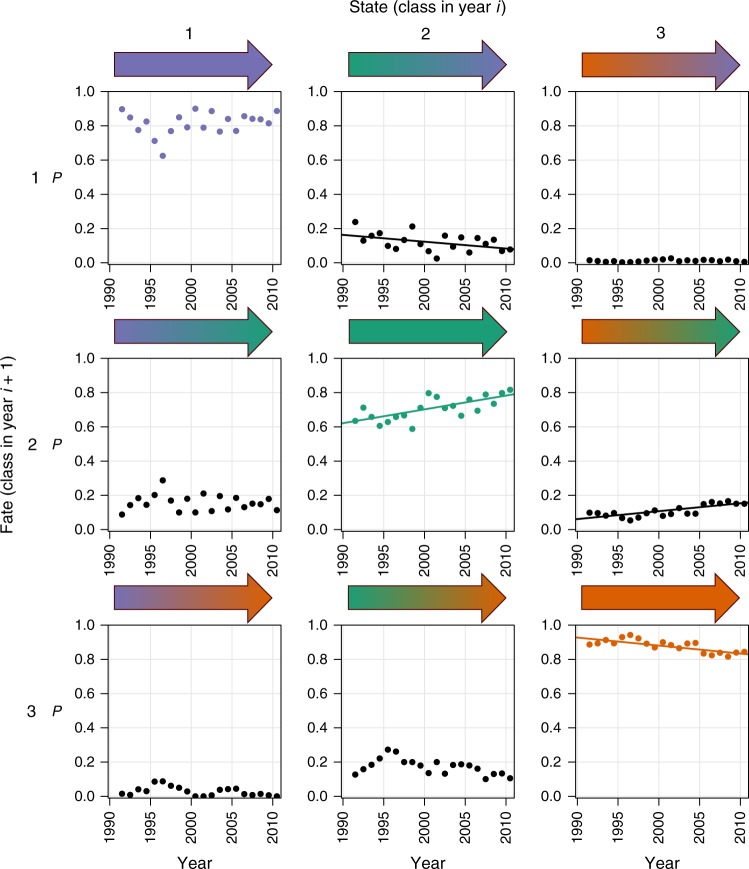
Fig. 2.
Annual transition probabilities between the three macroinvertebrate community classes (1991–2011) across England and Wales, based on the Markov chain. Each panel shows the probability (P) of a community in one of the three states in 1 year either staying in the same state or switching to one of the other two in the following year (its fate). Colours follow Fig. 1, with fill colours of the arrows indicating the transitions between the different states. The three panels forming the leading diagonal represent the probability of communities staying in the same state between years (= the persistence). Fitted linear regression lines are shown where the slope coefficient is significant at P ≤ 0.05 (see Supplementary Table 4 for regression results). Source data are provided as a Source Data file

