Fig. 6.
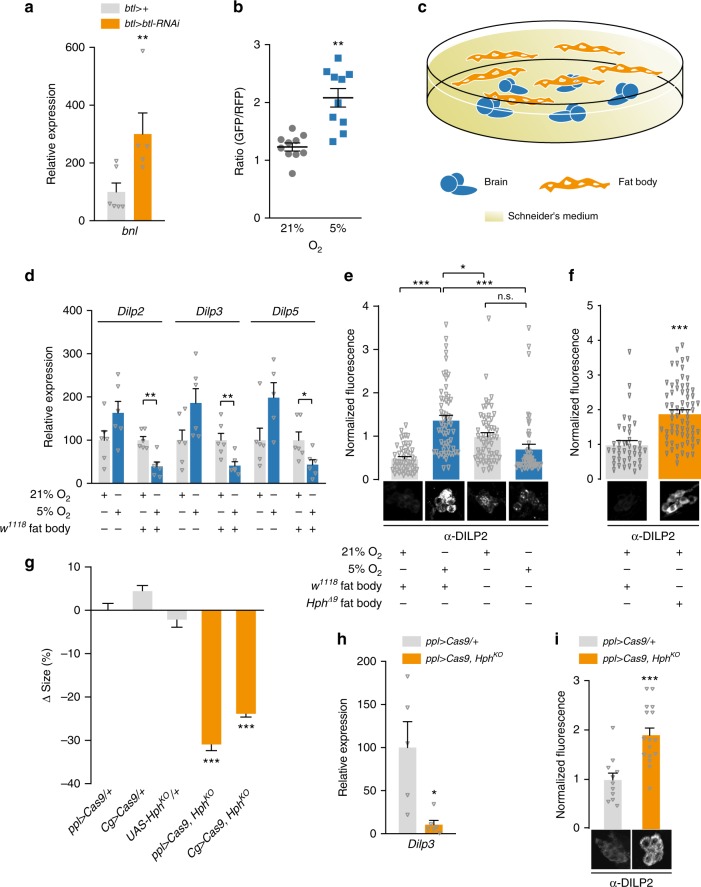
A fat-body hypoxia sensor represses insulin secretion from the brain. a Transcriptional upregulation of branchless (bnl) in the fat body of animals with trachea-specific btl knockdown indicates hypoxia. n = 5–6. b A transgenic reporter of hypoxia indicates that the fat body experiences low oxygen levels that inhibit Hph when animals are incubated under 5% O2 compared with 21% O2 conditions. Ratio of integrated GFP (carrying the oxygen-dependent degradation domain of HIF-1a) and RFP (without this domain) signals in fat body. n = 10. c Illustration of ex-vivo organ culture technique. d Transcript levels of Dilp genes in brains alone or brains and fat bodies cultured ex-vivo under hypoxia, compared with normoxic cultures. Dilp transcription was unchanged or increased (nonsignificant) when brains alone were exposed to hypoxia, whereas transcription of all three genes was reduced in brains co-incubated with fat-body tissue, closely mimicking the changes seen in whole animals. n = 5–6. e Ex-vivo co-culture of wild-type brains with wild-type fat bodies causes DILP2 retention under hypoxia. Brains incubated alone without fat body are unable to induce DILP2 retention under hypoxia. Thus, the presence of the hypoxic fat body actively represses DILP secretion. n = 50–58. f Co-culture of wild-type brains with Hph-mutant fat bodies induces DILP2 retention under normoxia (right). Representative images of DILP2 immunostainings in the IPCs are shown below. n = 40–67. g–i CRISPR/Cas9-induced fat-body-specific Hph knockout (HphKO) reduced pupal size (g) and transcript levels of Dilp3 (h), and caused DILP2 retention in the IPCs (i). Representative images of DILP2 immunostainings in the IPCs are shown below. The ppl> and Cg> fat-body GAL4 drivers were used to express UAS-driven Cas9 and gRNAs designed to delete part of the Hph locus specifically in the fat body. Controls: ppl > Cas9/+, Cg > Cas9/+, and UAS-HphKO/ + (HphKO/+). g: n = 23–44. h: n = 5–6. i: n = 11-16. Statistics: Student’s t-test for pairwise comparisons and one-way ANOVA with Dunnett’s for multiple-comparisons test. *P < 0.05, **P < 0.01, ***P < 0.001, compared with the control. Error bars indicate SEM. Underlying data are provided in the Source Data file

