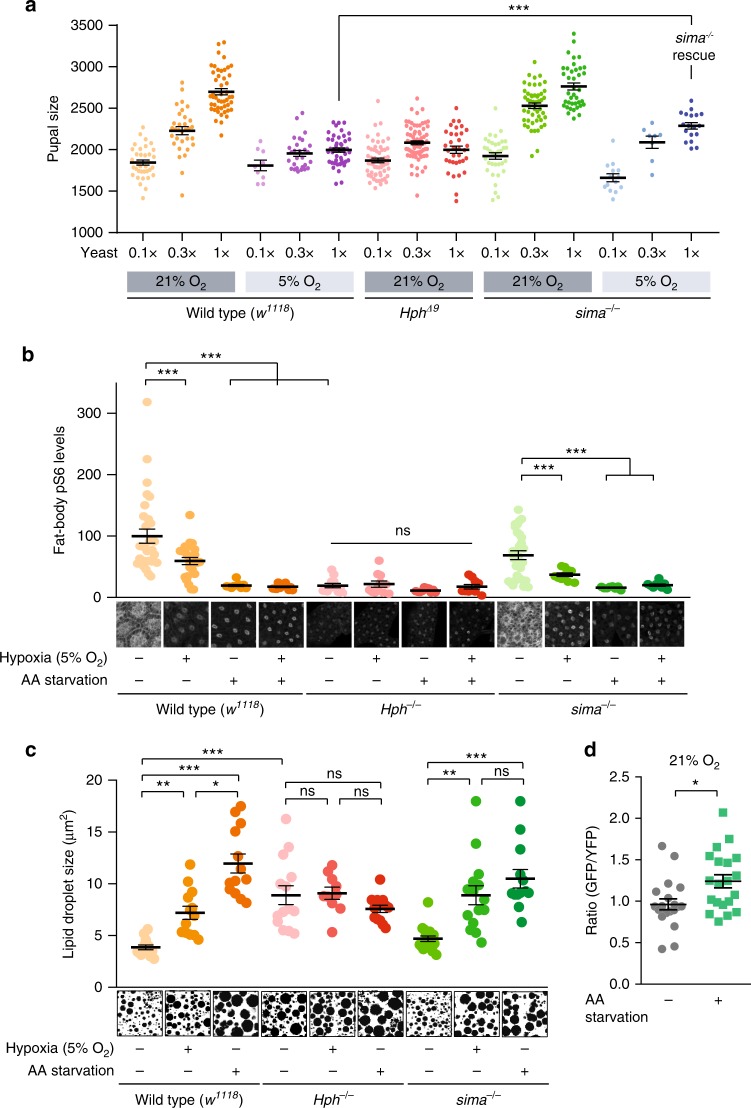
Fig. 7.
Hph-dependent amino-acid and oxygen sensing via Tor is HIF-1a/Sima-independent. a Growth response to dietary amino-acid levels (0.1×, 0.3×, and standard 1× dietary yeast concentrations) of wild types (w1118) and Hph and sima mutants under normoxia (21% O2) and hypoxia (5% O2). Note that sima mutants are significantly larger than wild types on 1× yeast food in hypoxia, whereas their sizes are not significantly different in normoxia (p = 0.26), further indicating that Sima is required for hypoxia-induced growth suppression. n = 8–71. b Fat-body staining against phosphorylated ribosomal protein S6 (anti-pS6), a downstream indicator of Tor activity, indicates that the Tor pathway is suppressed by 16 h amino acid starvation (1× sugar-only medium), hypoxia (5% O2), or Hph mutation. sima mutants exhibit Tor-pathway activation under normoxia, and thus Sima is not required for Tor activity. Tor activity decreases under hypoxia and with amino-acid deprivation, indicating that Sima activity is also not required for Tor suppression. Combined treatments of amino-acid starvation and hypoxia do not further suppress Tor. Representative images of pS6 stain are shown. n = 8–30. c Sizes of fat-body lipid droplets examined by CARS microscopy in wild types (w1118) and Hph and sima mutants with 16 h hypoxia (5% O2) or amino acid starvation (1× sugar-only medium). Lipid-droplet size increases under hypoxia and protein starvation in wild types and sima mutants, but not Hph mutants. Representative CARS images are shown. n = 10–18. d Hph activity reflects amino acid availability. Fat-body imaging of the GFP::ODD Hph-activity reporter indicates that GFP::ODD degradation is reduced under 4 h amino acid starvation (1x sugar food), suggesting that Hph activity is blocked by lack of amino acids. n = 20. Statistics: Student’s t-test for pairwise comparisons and one-way ANOVA with Dunnett’s for multiple-comparisons test. *P < 0.05, **P < 0.01, ***P < 0.001, compared with the control. Error bars indicate SEM. Underlying data are provided in the Source Data file

