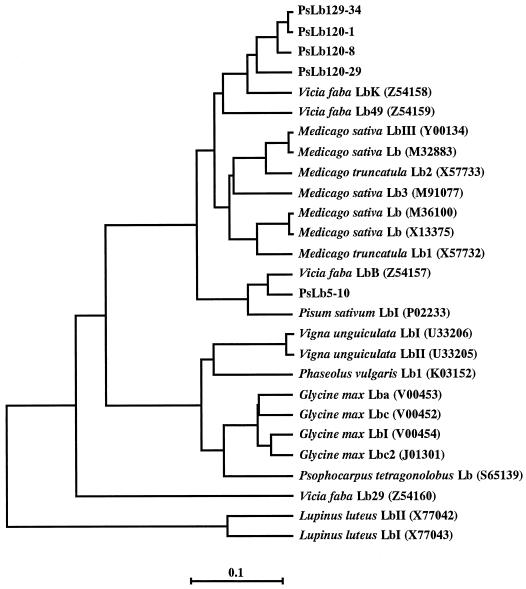
Figure 5.
Phylogenetic tree of the alignment of the amino acid sequences deduced from PsN5-10, PsN120-1, -8, -29, and -34, with other Lbs from main legumes. The phylogram was created by the unweighted pair group maximum average method in the GeneWorks program. Branch lengths reflect sequence diversity counted as the number of substitutions per site. The database accession numbers are indicated in parentheses after the Lb names.

