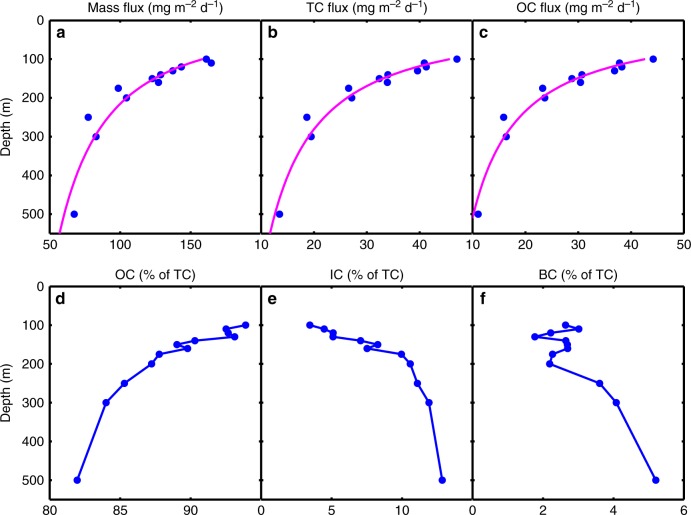
Fig. 1.
Mass and carbon fluxes. Flux profiles of a mass, b total carbon (TC), and c organic carbon (OC). The magenta curves are the best fits to a log–log transformed normalized power function of the form Fz = F100 (z/100)b where Fz is flux at depth z(m), F100 is flux at 100 m and b is the coefficient of flux attenuation (ref. 11; Supplementary Fig. 1). The best fit parameters are: mass flux, F100 = 158.5 mg m−2 d−1, b = −0.60, r2 = 0.85; TC flux, F100 = 45.71 mg C m−2 d−1, b = −0.80, r2 = 0.93; OC flux, F100 = 42.66 mg C m−2 d−1, b = −0.89, r2 = 0.93. Vertical fluxes of d OC, e IC and f BC expressed as percentages of TC for each depth

