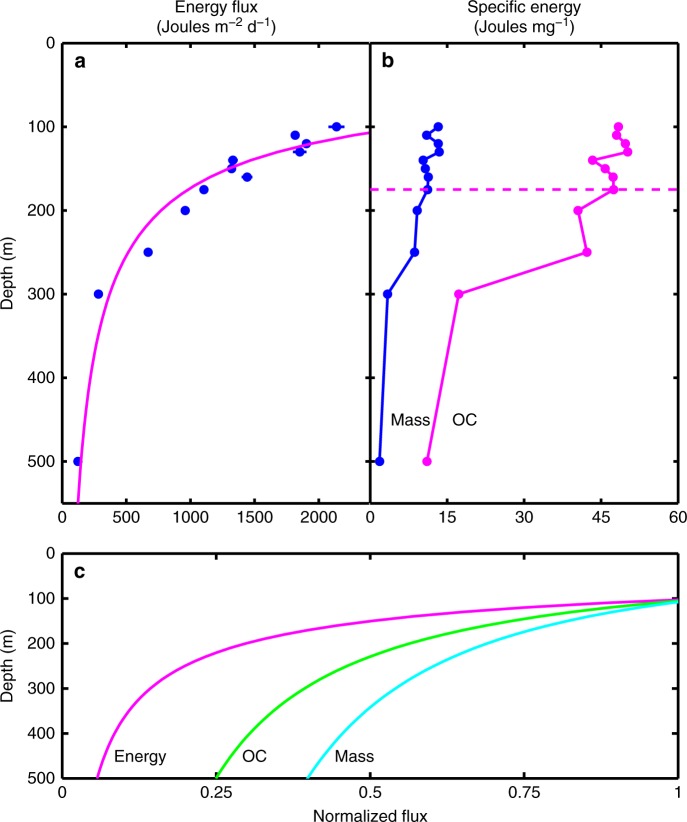
Fig. 2.
Energy fluxes. a Energy flux and b specific energy of SPM expressed in mass-specific (blue symbols) and OC-specific (magenta symbols) units. The magenta curve on the left is the best fit for the equation presented in Fig. 1 (also see Supplementary Fig. 2). The best fit parameters are: F100 = 2701.6 J m−2 d−1, b = −1.81, r2 = 0.90. The horizontal magenta dashed line on the right is the approximate depth of the photosynthetic compensation irradiance (see text for details). c Schematic representation of the flux profiles and flux attenuation coefficients for mass (blue curve, b = −0.60), OC (green curve, b = −0.89), and energy (magenta curve, b = −1.81)

