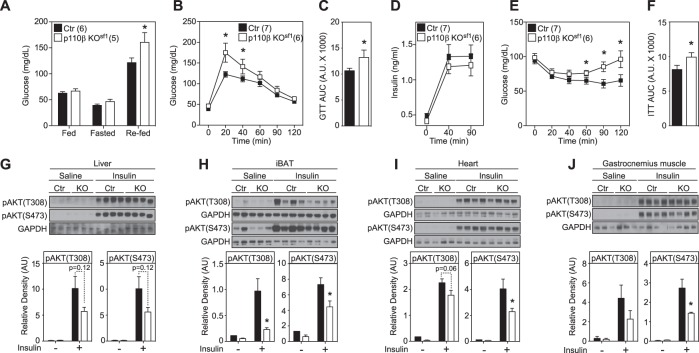
Fig. 2. Deletion of p110β in SF-1 neurons disrupts glucose and insulin homeostasis.
a Glucose levels in fed (3 h fasted), fasted (24 h), and refed (1 h) male mice. b GTT [significant interaction (two-way repeated ANOVA, F5.62 = 37.65, p < 0.0001)]. c Area under the curve (AUC) from b. d Insulin levels during the GTT. e ITT [significant interaction (two-way repeated ANOVA, F1.66 = 14.84, p = 0.00003)]. f Area under the curve (AUC) from e. Blunted insulin-induced pAKT activation in the g liver, h iBAT, i heart, and j gastrocnemius muscle of p110β KOsf1 mice. Number of mice in each group is indicated in the legends or directly in the figures. Data are shown as the mean ± SEM. *P < 0.05 by Student’s t-test

