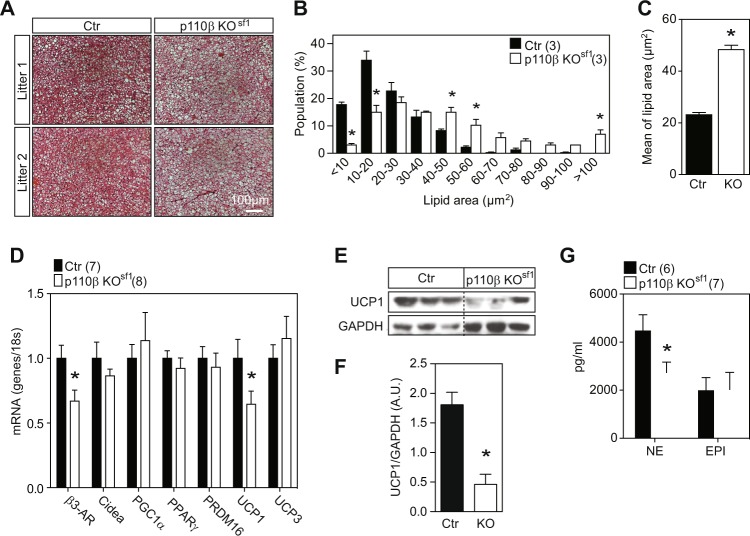
Fig. 3. Deletion of p110β in SF-1 neurons leads to the whitening of iBAT.
a Hematoxylin and eosin staining of iBAT from control and p110β KOsf1 mice. b Distribution (% of population) of lipid droplets from a [significant interaction (two-way ANOVA, F1.20 = 18.02, p = 0.0001)]. c Mean lipid area (μm2) of the droplets from a. d mRNA levels of genes in iBAT regulating BAT programming. e UCP1 protein levels in the iBAT of control and p110β KOsf1 mice. f Average UCP1 protein levels in the iBAT of control and p110β KOsf1 mice. g Plasma norepinephrine and epinephrine levels in chow-fed males. Number of mice in each group is indicated in the legends or directly in the figures. Data are shown as the mean ± SEM. *P < 0.05 by Student’s t-test. EPI, epinephrine; Ctr, control; NE, norepinephrine

