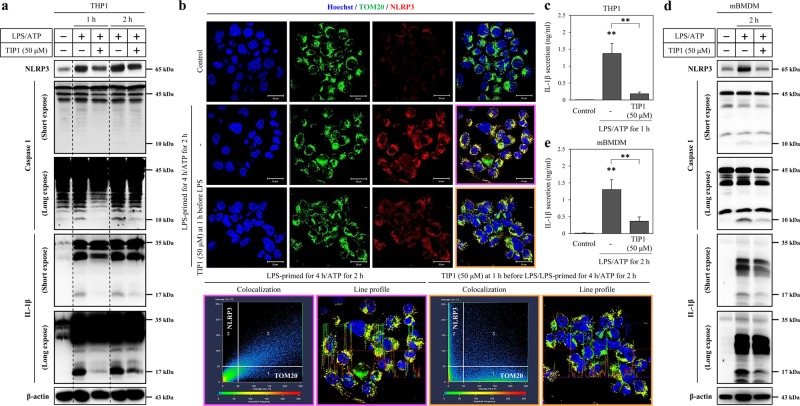
Fig. 3. Inhibitory effects of TIP1 on NLRP3-mediated responses.
The antagonistic effects of TIP1 were evaluated in LPS-primed (1 μg/ml for 4 h) THP1 cells treated with ATP (5 mM). When TIP1 treatment was required, TIP1 was added at 1 h before LPS treatment. a The expression levels of NLRP3, procaspase 1 (45 kDa), active caspase 1 (10 kDa), pro-IL-1β (35 kDa), and mature IL-1β (17 kDa) were measured by western blotting at 1 and 2 h. β-Actin served as a loading control. b The expression of TOM20 and NLRP3 was measured by immunofluorescent staining and confocal microscopy. Hoechst was used for nucleus staining (scale bar represents 20 μm). The scatterplot shows the correlation of TOM20 and NLRP3 channels, and the line profile image shows fluorescence intensity for TOM20, NLRP3, and Hoechst. c The secretion of IL-1β in THP1 cells was evaluated by ELISA. d LPS-primed (1 μg/ml for 4 h) mBMDM cells were treated with ATP (5 mM) for 2 h. The expression levels of NLRP3, procaspase 1 (45 kDa), active caspase 1 (10 kDa), pro-IL-1β (35 kDa), and mature IL-1β (15 kDa) were measured by western blotting. β-Actin was used as a loading control. e The secretion of IL-1β by mBMDM cells was measured by an ELISA. The data shown represent at least three independent experiments (n ≥ 3), and bars denote the mean ± SEM (*P < 0.05, **P < 0.01)

