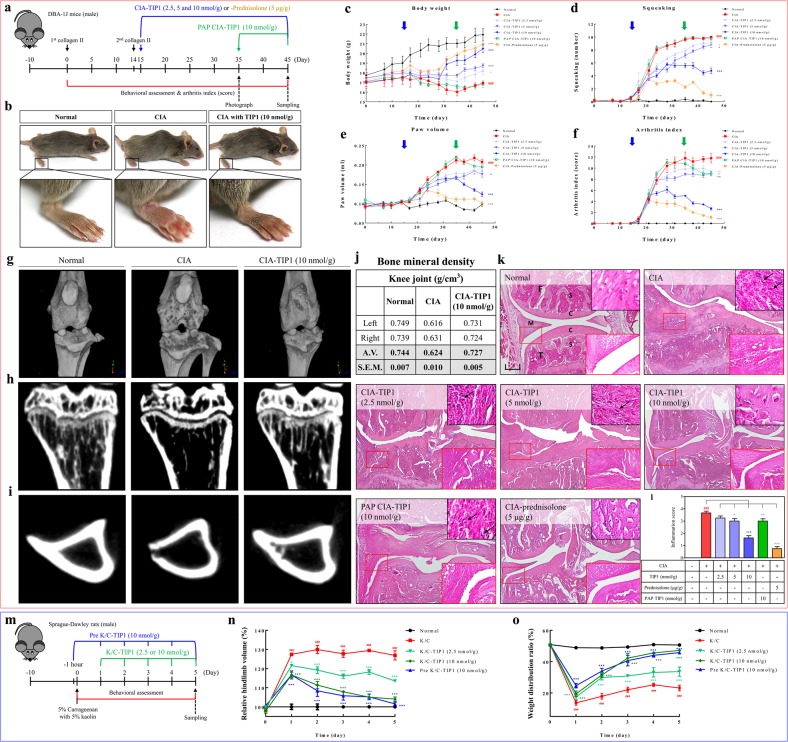
Fig. 6. Protective effects of TIP1 against CIA and K/C in rodent models.
a A summary of the experimental validation of the inhibitory effect of TIP1 in the RA model. DAB-1J male mice (n = 9) were first subcutaneously (s.c.) injected with type II collagen and then s.c. injected with type II collagen after 14 days. Two types of experiments were designed. First, mice were daily i.p. injected with one of three concentrations of TIP1 (2.5, 5, or 10 nmol/g) or, as a positive control, prednisolone (5 mg/kg), for 30 days. Second, starting on day 25, the mice were daily i.p. injected with TIP1 (10 nmol/g) for 10 days to test the postarthritis phase (PAP). (b) On day 45, photographs showing the overall representative shapes of the paws were taken, and then magnified features of right hind paws were evaluated. c–f During the experiments, the mice were analyzed for (c) body weight, (d) squeaking, (e) paw volume, and (f) RA index. Blue and green arrows indicate two time points of TIP1 treatment: starting the injection on day 15 (blue arrow) before the development of arthritic inflammation or on day 35 (green arrow) after full development of arthritis, respectively. Numerical data are presented as the mean ± SEM: #P < 0.05, ##P < 0.01, and ###P < 0.001 CIA vs. Normal; *P < 0.05, **P < 0.01, and ***P < 0.001 TIP1 vs. CIA. g Representative 3D images of the knee joints were measured using micro-CT. Representative 2D images of (h) trabecular bone corresponding to the sagittal section at the top of tibia and (i) cortical bone corresponding to the horizontal section in the middle of tibia were measured by micro-CT. j The bone mineral densities (BMD) of the right or left knee joints were measured by micro-CT. k Representative sections of knee joints from normal, CIA, CIA with TIP1 (2.5, 5, or 10 nmol/g), and CIA with prednisolone (5 μg/g) were evaluated by hematoxylin and eosin (H&E) staining to show synovial hyperplasia (original magnification × 40). The black scale bar indicates 200 μm (× 40 magnification). Insets in the upper right corners show inflammatory cell infiltration. Small red squares in H&E-stained images are magnified in the bottom right insets (× 200). C: cartilage, S: subchondral bone, F: femur, T: tibia, M: meniscus. l Histograms present quantification of synovial hyperplasia scores. m–o To demonstrate the in vivo therapeutic effects of TIP1, the antiarthritic efficacy of TIP1 was tested in a rat model of acute arthritis induced by kaolin/carrageenan (K/C) injection. m Monoarthritis was induced in one knee by a single injection of 5% carrageenan + 5% kaolin (dissolved in 100 μl of saline) into the intra-articular space of the right knee joint on day 0. Each dose of TIP1 was i.p. administered daily for 5 days starting on day 1, 2 h before every measurement of arthritic symptoms such as pain and edema. n Arthritic edema was measured with the digital Plethysmometer and was expressed as a relative change in arthritic-paw volume toward the unaffected paw. o Arthritic pain was quantified with the incapacitance meter by determining weight-bearing forces of both hindlimbs (weight distribution ratio; WDR). The data shown represent at least three independent experiments (n ≥ 3), and bars represent means ± SEM; ###P < 0.001: CIA vs. normal, and *P < 0.05, **P < 0.001, ***P < 0.001: TIP1 vs. CIA

