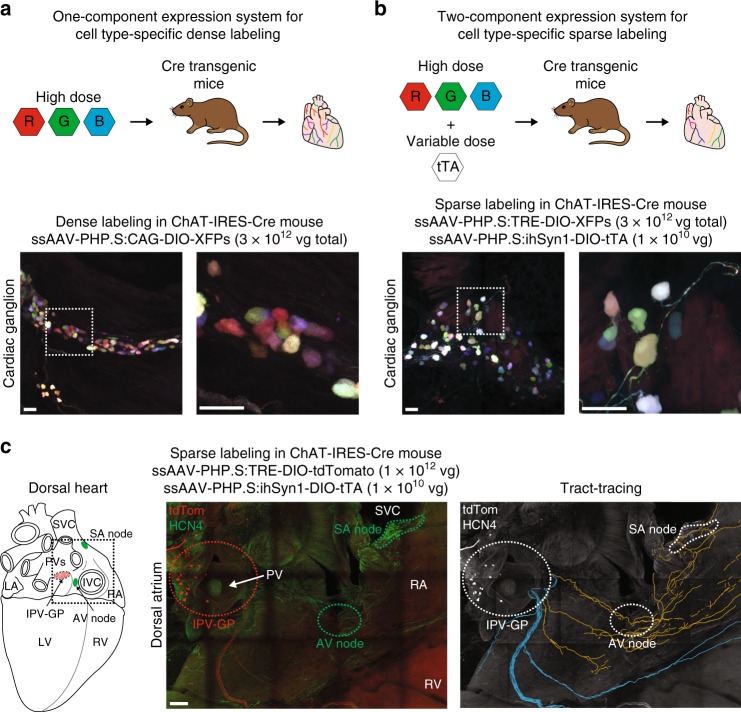
Fig. 2.
AAV-based labeling and tracing of cholinergic neurons on the heart. a Schematic of the one-component expression system for cell type-specific, dense multicolor labeling (top). To densely label cholinergic neurons in cardiac ganglia, ChAT-IRES-Cre mice were systemically co-administered 3 Cre-dependent vectors expressing either mRuby2, mNeonGreen, or mTurquoise2 from the ubiquitous CAG promoter (ssAAV-PHP.S:CAG-DIO-XFPs) (1 × 10¹² vector genomes (vg) each; 3 × 10¹² vg total). A MIP image of a densely labeled cardiac ganglion (bottom left). Inset shows a higher magnification image (bottom right). b Schematic of the two-component expression system for cell type-specific, sparse multicolor labeling (top). Expression of XFPs is dependent on cotransduction of an inducer in Cre-expressing cells. The dose of the inducer vector can be titrated to control extent of XFP labeling. To sparsely label cholinergic neurons in cardiac ganglia, ChAT-IRES-Cre mice were systemically co-administered 3 Cre-dependent vectors expressing XFPs from the TRE-containing promoter (ssAAV-PHP.S:TRE-DIO-XFPs) (1 × 10¹² vg each; 3 × 10¹² vg total) and a Cre-dependent inducer vector expressing the tTA from the ihSyn1 promoter (ssAAV-PHP.S:ihSyn1-tTA) (1 × 10¹⁰ vg). A MIP image of a sparsely labeled cardiac ganglion (bottom left). Inset shows a higher magnification image (bottom right). c To trace cholinergic fibers, presumably from cardiac ganglia, sparse labeling was performed by systemically co-administering ssAAV-PHP.S:TRE-DIO-tdTomato at a high dose (1 × 10¹² vg) and ssAAV-PHP.S:ihSyn1-DIO-tTA at a lower dose (1 × 10¹⁰ vg). Cartoon of the dorsal heart depicting the orientation of images (left). A MIP image of the dorsal atrium with native tdTomato fluorescence (red) and HCN4 staining (green) (middle). Fibers were traced with neuTube and overlaid on a grayscale MIP image (right). Orange fibers coursed along the right atrium (RA) including the sinoatrial (SA) and atrioventricular (AV) nodes and blue fibers along the ventricles. Scale bars are 50 µm (a, b) and 200 µm (c). All images were acquired on tissue collected 3 weeks after intravenous injection. IPV-GP inferior pulmonary vein-ganglionated plexus, IVC inferior vena cava, LA left atrium, LV left ventricle, PV pulmonary vein, RV right ventricle, SVC superior vena cava

