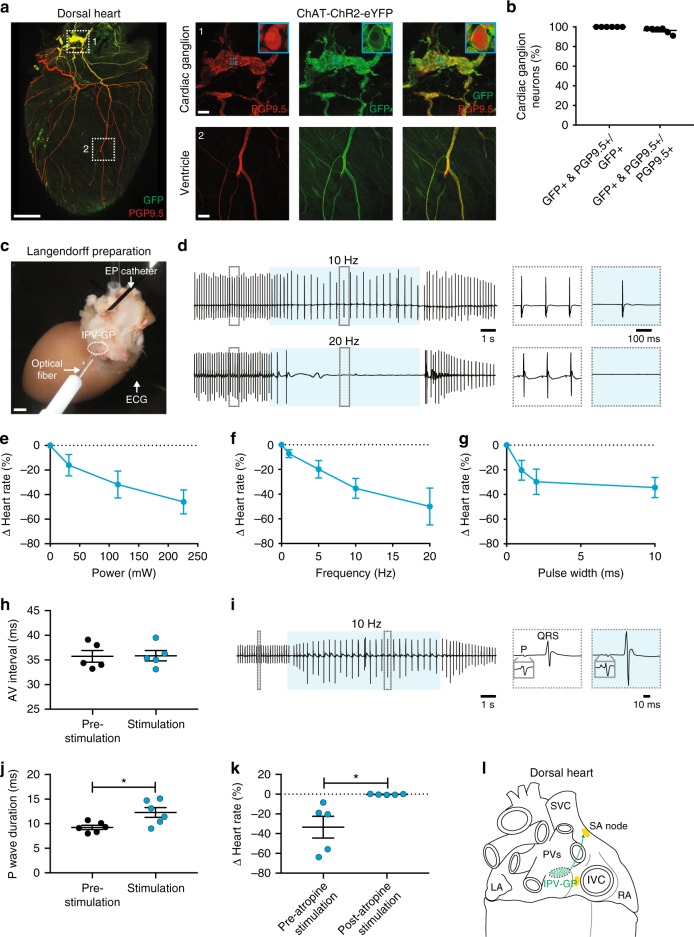
Fig. 3.
Ex vivo optogenetic stimulation of cholinergic neurons in the IPV-GP. a A 3D projection (1200 µm z-stack) of the dorsal side of a heart from a ChAT-ChR2-eYFP mouse whole-mount stained with PGP9.5 (red) and GFP (green). Insets 1 and 2 show MIP images of a cardiac ganglion and the ventricle, respectively. Blue dashed boxes indicate location of higher magnification images in blue boxes. b Percentage of cardiac ganglion neurons expressing GFP and PGP9.5 over those expressing GFP or PGP9.5. c Langendorff-perfused hearts were used for optogenetic stimulation of cholinergic neurons in a cardiac ganglion. A blue laser-coupled optical fiber was positioned for focal illumination of the IPV-GP (circle). A surface electrocardiogram (ECG) was recorded with bath electrodes and intracardiac electrograms with an electrophysiology (EP) catheter. d Representative ECGs during stimulation (blue shading) at 10 Hz, 10 ms, and 221 mW (top) and 20 Hz, 10 ms, and 221 mW (bottom). Insets show the ECGs before and during stimulation. e–g Dose response curves summarizing the effects of altering light pulse power (e), frequency (f), and pulse width (g) on heart rate. h Summary of the AV interval before and during stimulation at 10 Hz and 10 ms (t4 = 0.1656, P = 0.8765). i Representative ECG during stimulation (blue shading) at 10 Hz, 10 ms, and 221 mW. Insets show a single beat before and during stimulation, with gray boxes showing a higher magnification of the P wave. j The P wave duration before versus during stimulation (t5 = 2.920, *P = 0.0330). k Summary of the heart rate response to stimulation before versus after atropine administration (t4 = 2.993, *P = 0.0402). l Cartoon of the dorsal heart depicting the IPV-GP-SA node circuit. n = 6 mice (b, e–g, j) and 5 mice (h, k); mean ± s.e.m.; paired, two-tailed t-test. Scale bars are 1 mm (a (left), c) and 100 µm (a (right))

