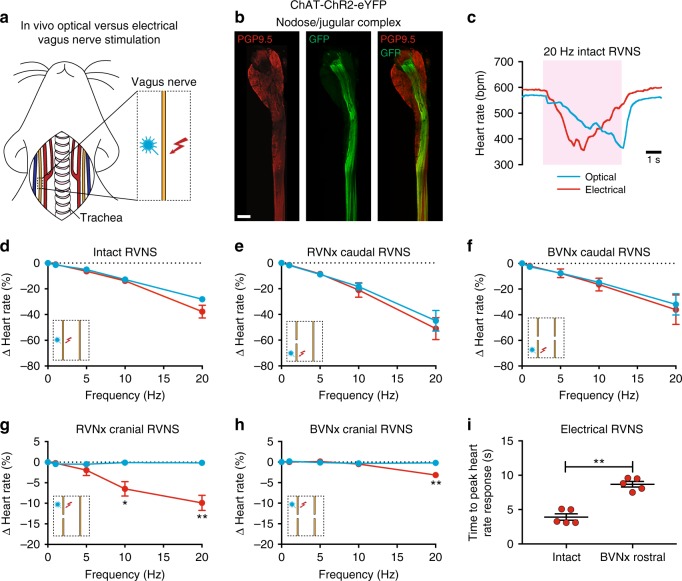
Fig. 4.
In vivo optogenetic versus electrical stimulation of the vagus nerve. a Cartoon depicting optogenetic and electrical vagus nerve stimulation strategy in ChAT-ChR2-eYFP mice. The right vagus nerve was surgically exposed in anesthetized mice and either light or electricity was used for stimulation. b MIP images of the right nodose/jugular ganglion complex and vagus nerve whole-mount stained with PGP9.5 (red) and GFP (green). c Representative heart rate responses during optogenetic versus electrical right vagus nerve stimulation (RVNS; magenta shading) at identical frequencies (20 Hz) and pulse widths (10 ms) in the intact state. The light pulse power for optogenetic stimulation was 57 mW and the current for electrical stimulation was 5 µA. d Frequency response curves summarizing the effects of optogenetic versus electrical RVNS on heart rate in the intact state. e, f Frequency response curves summarizing the effects of optogenetic versus electrical RVNS of the caudal end on heart rate following right vagotomy (RVNx) (e) and bilateral vagotomy (BVNx) (f). g, h Frequency response curves summarizing the effects of optogenetic versus electrical RVNS of the cranial end on heart rate following RVNx (t4 = 3.576, *P = 0.0232 at 10 Hz; t4 = 5.229, **P = 0.0064 at 20 Hz) (g) and BVNx (t4 = 8.588, **P = 0.0010 at 20 Hz) (h). In d–h insets show a schematic of the stimulation protocol. i The time to peak heart rate response during electrical RVNS in the intact state versus of the cranial end following BVNx (t4 = 6.335, **P = 0.0032). n = 8 mice (d), three mice (e, f), and five mice (g, h, i); mean ± s.e.m.; paired, two-tailed t-test. Scale bar is 200 µm (b)

