Fig. 6.
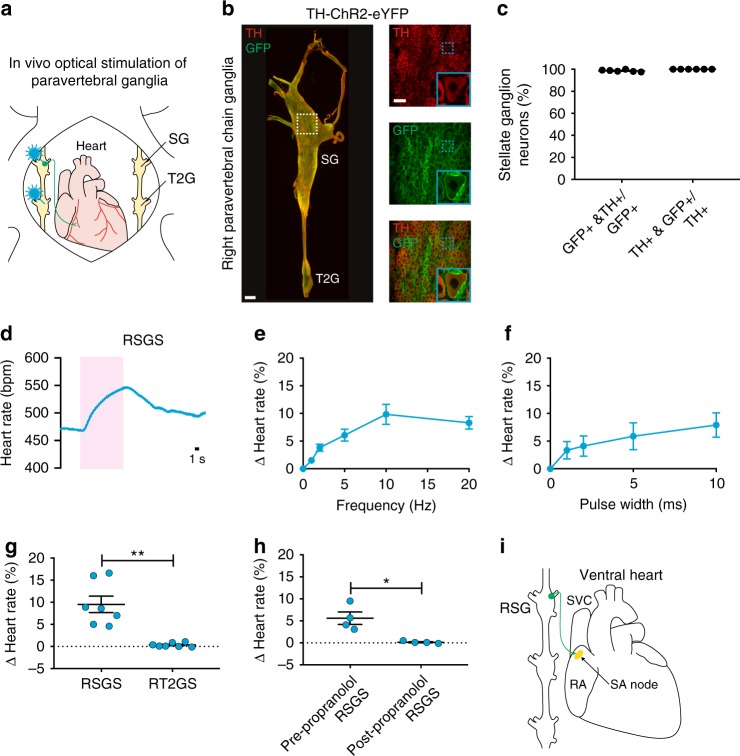
In vivo optogenetic stimulation of noradrenergic neurons in the RSG. a Cartoon depicting optogenetic SG and T2G stimulation strategy in TH-ChR2-eYFP mice. The right paravertebral chain was surgically exposed in anesthetized mice and light was used for stimulation. b A MIP image of the right paravertebral chain whole-mounted stained with TH (red) and GFP (green) and showing the SG and the T2G. Inset shows single-plane images of the SG. Blue dashed boxes indicate location of higher magnification images in blue boxes. c Percentage of stellate ganglion neurons expressing GFP and TH over those expressing GFP or TH. d Representative heart rate response during 10 Hz, 10 ms, and 126 mW craniomedial RSG stimulation (RSGS). e, f Dose response curves summarizing the effects of altering craniomedial RSGS frequency (e) and pulse width (f) on heart rate. g Summary of the heart rate response to craniomedial RSGS versus right T2G stimulation (RT2GS) (t6 = 5.435, **P = 0.0016). h Summary of the heart rate response to craniomedial RSGS before versus after propranolol administration (t3 = 3.951, *P = 0.0289). i Cartoon of the ventral heart depicting the craniomedial RSG-SA node circuit. n = 6 mice (c), seven mice (e, g), five mice (f), and four mice (h); mean ± s.e.m.; paired, two-tailed t-test. Scale bars are 200 µm (b (left) and 50 µm (b (right)

