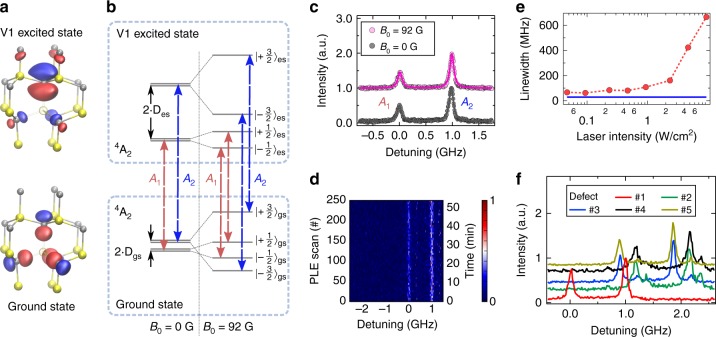
Fig. 1.
Optical transitions of the silicon vacancy in 4H-SiC. a Crystalline structure of 4H-SiC with a silicon vacancy centre at a hexagonal lattice site. Upper (lower) figure shows the square moduli of the defect wave functions of the V1 excited (ground) state, as calculated by density functional theory. Red (blue) shaded areas symbolise that the wave function has a positive (negative) sign. The yellow and grey spheres represent silicon and carbon atoms, respectively, and the crystallographic c-axis is aligned vertically in this figure. b Ground and excited state level scheme with and without a magnetic field applied along the c-axis. Red (blue) optical transitions labelled A1 (A2) connect spin levels mS = ±1/2 (mS = ±3/2). c Resonant absorption spectrum of a single vacancy centre at B0 = 0 G and B0 = 92 G. Lines are fits using a Lorentzian function. d Repetitive resonant absorption scans at B0 = 92 G over 52 min without any sign of line wandering. The colour bar indicates the normalized intensity in arbitrary units. e Absorption linewidth of the peak A2 as a function of the resonant pump laser intensity. Below 1 W/cm2 no power broadening is observed and the linewidth is close to transform limited as indicated by the blue line. f Resonant absorption spectra of five single defect centres, showing several defects with almost identical separation between two ZPLs and linewidth but inhomogeneously distributed

