Fig. 4.
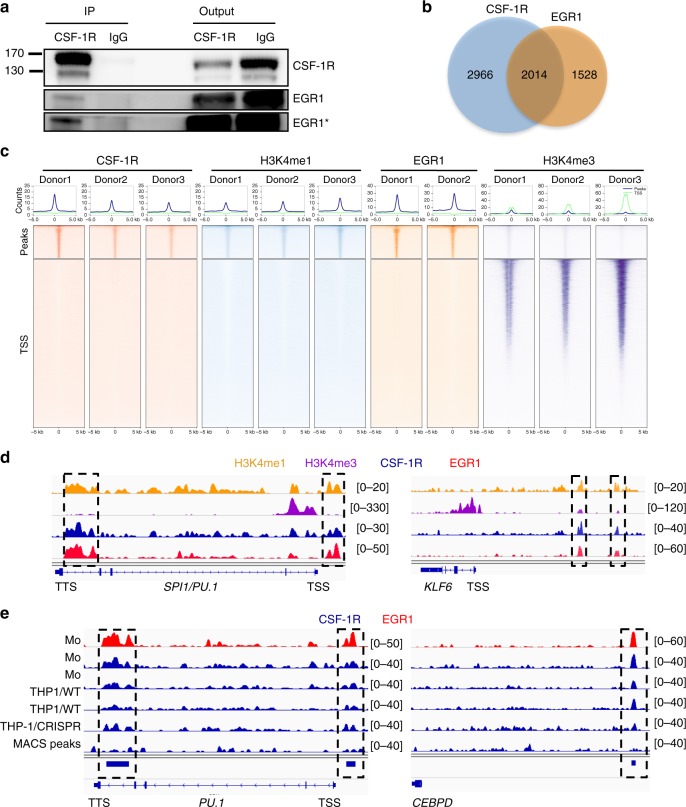
CSF-1R interacts with EGR1 to modulate gene expression. a Co-immunoprecipitation experiment using an anti-CSF-1R (sc-365719) or a control IgG in monocytes followed by immunoblotting with anti-CSF-1R and anti-EGR1 antibodies (n = 3). Asterisk (*) indicates a longer exposure of the blot. b Venn diagram of peak calling (input normalization) common to three donors from ChIP-seq experiment with sc-46662 anti-CSF-1R and sc-110X anti-EGR1 antibodies. c Ranking heatmap centered on CSF-1R peaks (top) and on gene transcription starting sites (TSS) of CSF-1R, H3K4me1, EGR1 and H3K4me3 peaks in monocytes. d Peak calling for H3K4me1 (orange), H3K4me3 (purple), EGR1 (red), CSF-1R (blue). ChIP-seq on PU.1 and KLF6 genes in monocytes (TSS: transcription starting site, TTS: transcription termination site). e Peak calling on PU.1 and CEBPD genes for EGR1 in monocytes and for CSF-1R in monocytes (Mo) from two donors (in blue, same donors as in Fig. 3), wild-type THP-1 clones (THP1/WT), THP-1 clones deleted for EGR1 (pool of 3 clones, THP1/CRISPR)

