Fig. 7.
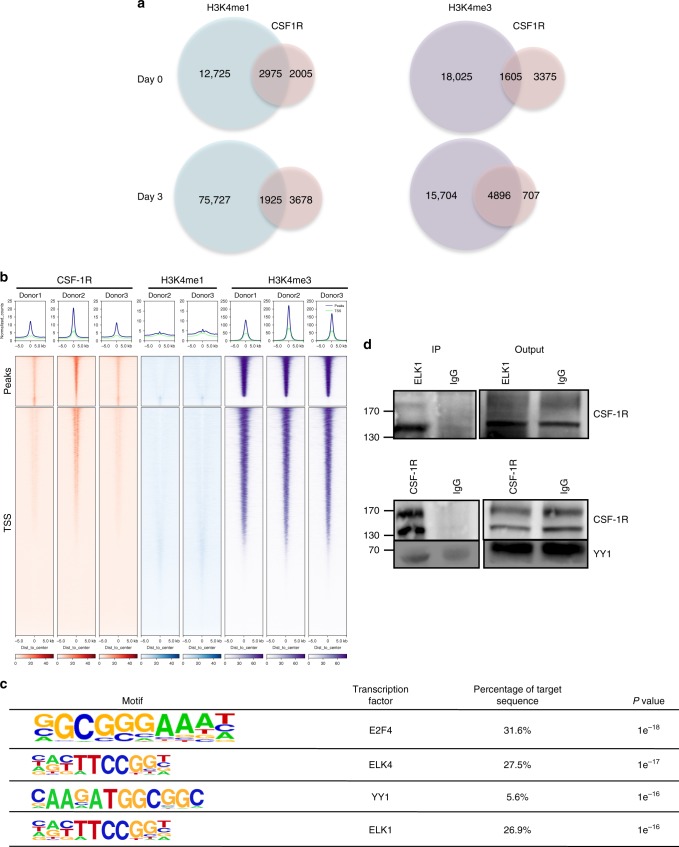
Differential CSF-1R chromatin localization in CSF-1-induced macrophages. a Venn diagram of ChIP-seq peak number in untreated monocytes (Day 0) and monocytes treated with 100 ng/mL CSF-1 for 3 days (Day 3) showing peaks common to the 3 donors. Left: CSF-1R and H3K4me1 peaks; right: CSF-1R and H3K4me3 peaks. b Ranking heatmap centered on CSF-1R peaks (top) and on gene transcription starting sites (TSS) of CSF-1R, H3K4me1 and H3K4me3 peaks in CSF-1-differentiated macrophages (3 days 100 ng/mL). c Motif analysis of ChIP-seq experiment on 3 day CSF-1 differentiated monocytes (100 ng/mL). d Co-immunoprecipitation of CSF1R and ELK1 (upper panel) or YY1 (lower panel). Immunoprecipitation (IP) was performed with an anti-ELK1 (sc-365876) or anti-CSF-1R (sc-365719) and a control IgG in monocytes treated for 3 days with 100 ng/mL CSF-1, followed by immunoblotting with an anti-CSF-1R (n = 2 each) or an anti-YY1 (n = 3) antibodies

