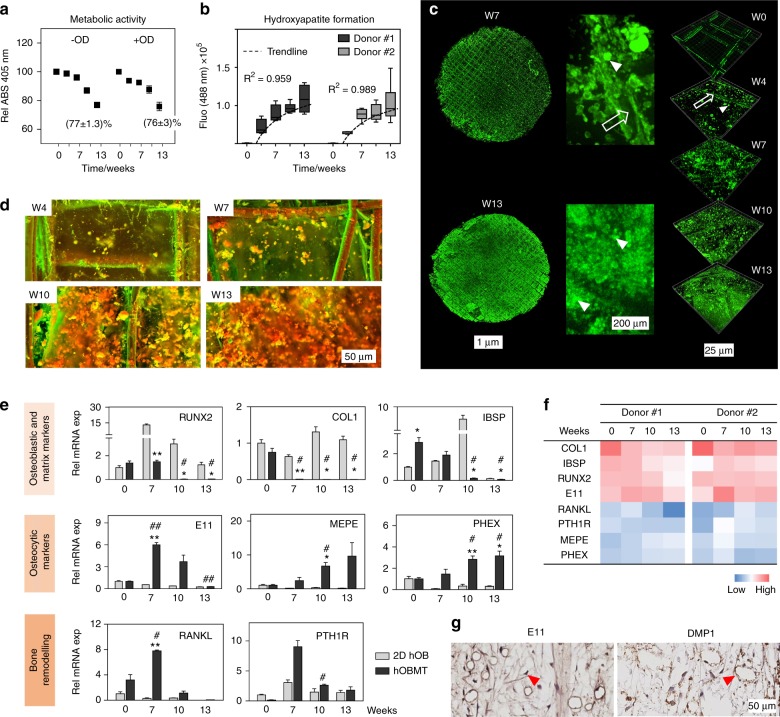
Fig. 2.
hOBMT mineralization and gene expression profile during osteoblastic maturation. a Metabolic activity of the hOBMT shows similar rates between undifferentiated microtissues (GM) and osteogenically differentiated microtissues (OM) over time (N = 3 donors, means ± SE). b Three-dimensional (3D) quantification of hydroxyapatite (HA) formation over time ( = 6, means ± SE), showing logarithmic correlation (R2 > 0.95). c Confocal images of hOBMT (donor #1) stained for hydroxyapatite (green), (Max Proj, 500 µm and 50 µm, z-stacks). Open arrows show fibers and arrow heads show deposited HA nodules. d Secondary electron and back scattered electron SEM images of hOBMT over time. The red/orange and green colors indicate denser and less dense material, respectively. Both c and d show increased mineralization over time. e Gene expression for 2D hOBs and the hOBMT over time, normalized to week 0 in 2D. Significance is shown for microtissues compared to 2D at each time point (*) and for the hOBMT at week 7, 10, and 13 compared to week 0 (#). *,#P < 0.05, **, ##P < 0.01. f Heat map of mean ΔCq values of hOBMT from two donors showing similar expression across genes. g Immunohistochemistry staining shows the expression of early (E11/podoplanin) and late [dentin matrix acidic phosphoprotein (DMP-1)] osteocytic cell markers in the hOBMT microtissues (arrow heads), after 7 weeks of osteogenic culture

