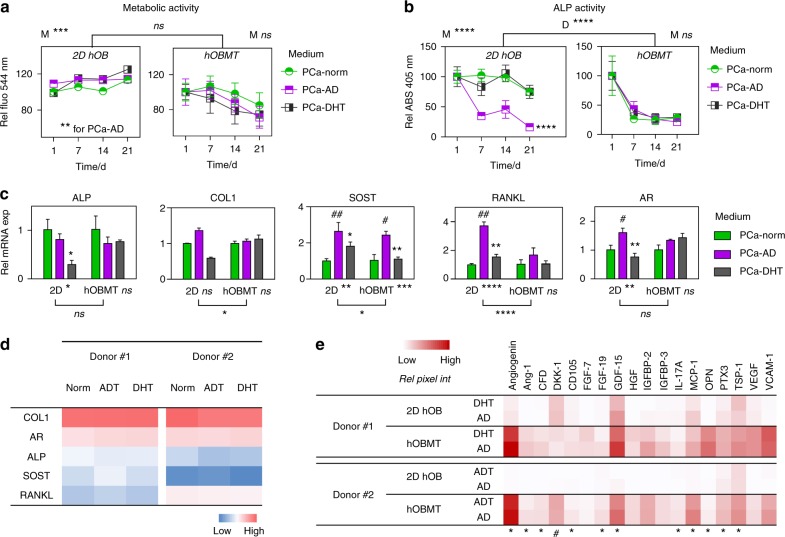
Fig. 3.
hOBMT function, mRNA, and protein levels in the presence of dihydrotestosterone (DHT) and in androgen-deprived conditions. a Metabolic activity and b alkaline phosphatase (ALP) activity in medium for the hOBMT and 2D hOBs after 10 weeks of osteogenic maturation, followed by 21 days culture in prostate cancer (PCa) media. Expressed as % to Day 1 control (PCa-Norm). Day 1 refers to the first day following the 10 weeks of normal hOBMT maturation ( = 4, means ± SE). P-values are compared to PCa-Norm. M shows the P-values for overall effect of Medium. c Gene expression for 2D hOBs and the hOBMT after 10 weeks of osteogenic maturation, followed by a 10-day treatment in PCa media. Fold changes are normalized to PCa-Norm for each dimension. Hashtags (#) show significance for PCa-AD compared to PCa-Norm, and asterisks (*) show significance for PCa-DHT compared PCa-AD (N = 3, means ± SE). d Heat map of mean ΔCq values for two donors, showing similar gene expression variations across media. Blue = low gene expression, red = high gene expression. e Protein expression shows similar expression from PCa-AD to PCa-DHT media within each dimension (2D and hOBMT), as measured by relative pixel intensity from microarray membranes shown as heat map of means from two donors (#1, #2). The asterisks and hashtags refer to <20% increase or >20% decrease from DHT to AD medium, respectively

