Fig. 5.
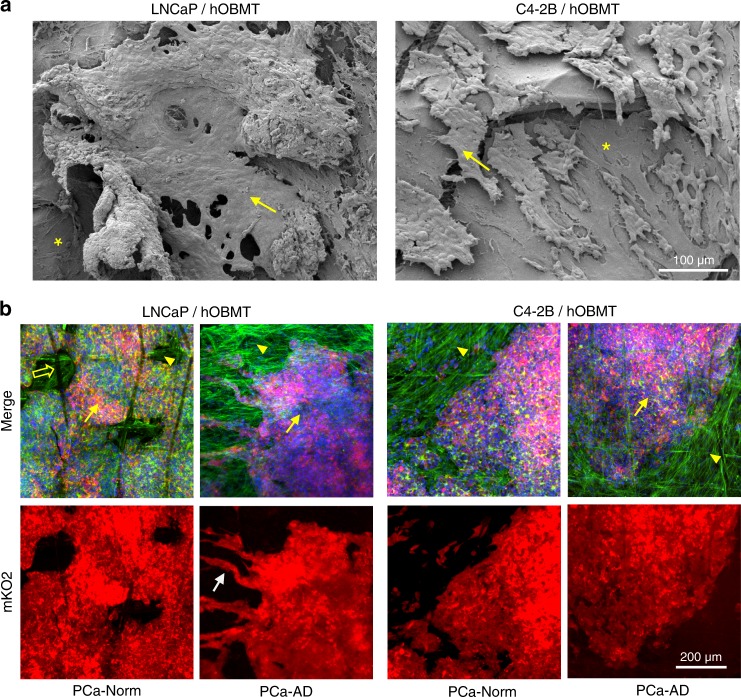
Morphologies of LNCaP and C4-2B cells after long-term co-culture with the hOBMT. a SEM images show that LNCaP and C4-2B cells attached and aligned onto the surface of the hOBMT, adhering to each other and to the hOBMT to form bulk micro-metastatic aggregates by 21 days of culture. The asterisks show the hOBMT and the arrows show the cancer cells. b Confocal images show the corresponding 3D morphologies (Max Proj, 70 µm z-stack) of aggregated cancer cells. C4-2B cells display similar morphologies between PCa-Norm and PCa-AD medium, but LNCaP aggregates show sprouting of cancer cells from bulk (white arrow) in PCa-AD. Split channels show LNCaP and C4-2B cells (mKO2, red), and merged images (mKO2 in red, DAPI in blue, Phalloidin in green). The open arrow shows a scaffold fiber, the arrow heads show the hOBMT and the full arrows show the cancer cells

