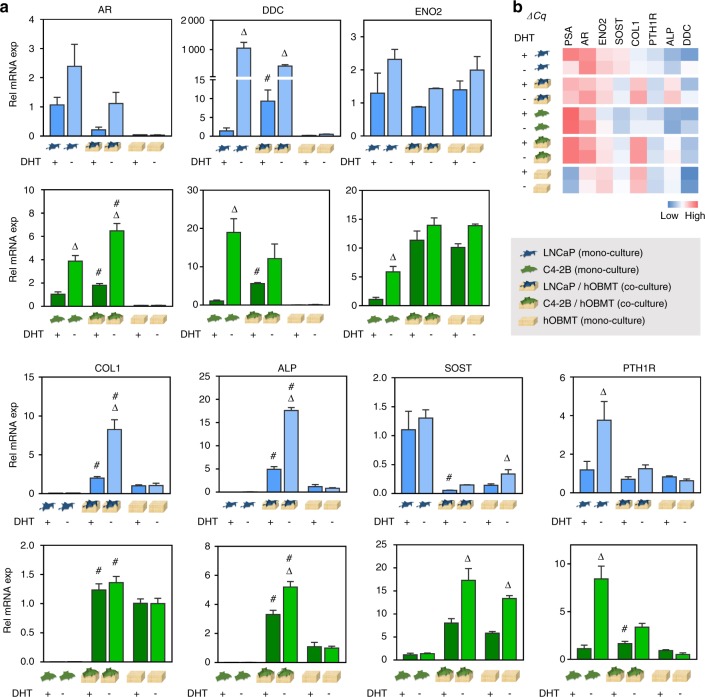
Fig. 6.
Gene regulation of prostate cancer cell (PCa)/hOBMT co-cultures. a Relative mRNA expression levels of PCa cell monocultures, hOBMT and PCa/hOBMT co-cultures (LNCaP dataset in blue, C4-2B dataset in green), in PCa-DHT (10 nM DHT) and PCa-AD (no DHT). Gene fold is normalized to PCa cell monocultures in PCa-DHT for all genes, except collagen-I (COL1) and alkaline phosphatase (ALP) (normalized to hOBMT in PCa-DHT). N = 3, means ± SE. Delta signs (Δ) show significance from PCa-DHT to PCa-AD within each sub-group. Hashtags (#) show significance of PCa/hOBMT co-cultures to both PCa cell monocultures and hOBMT, for each medium condition. b Corresponding heat map of mean ΔCq values

