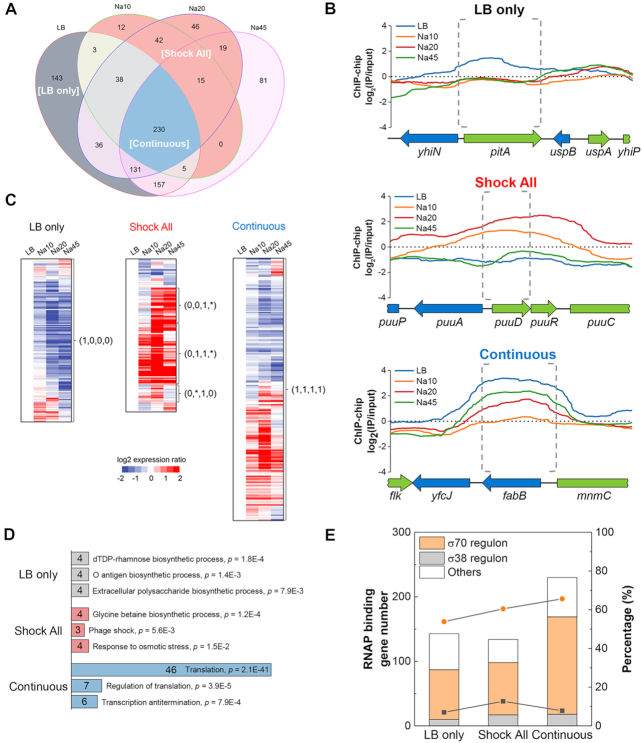
Figure 2.
‘LB only’, ‘Shock All’ and ‘Continuous’ genes with differential salt sensitivities to RNAP binding. (A) Venn diagram depicting the overlap in the number of RNAP-binding genes among LB, Na10, Na20 and Na45. LB only, gray background; Shock All, red background; Continuous, blue background. (B) Representative RNAP-binding profiles of the genes in ‘LB only’, ‘Shock All’ and ‘Continuous’. The upstream intergenic and coding regions of the target genes in each subset are indicated by gray dashed brackets. The binding profiles below ‘0’ means the RNAP-binding intensity is lower than the negative control. (C) Different patterns of gene expression in ‘LB only’, ‘Shock All’ and ‘Continuous’. The Log2 ratio of gene expression at Na10, Na20 and Na45 relative to LB is shown. The four numbers in parentheses from left to right represent the RNAP-binding state at LB, Na10, Na20 and Na45, respectively. ‘0’, no RNAP binding; ‘1’, RNAP binding. ‘*’ represents ‘0’ or ‘1’. (D) Enriched Go biological processes in ‘LB only’, ‘Shock All’ and ‘Continuous’. Only the top three biological processes are listed. Numbers in the bar indicate the number of genes enriched in each corresponding biological process. (E) Gene number (columns) and percentage (lines) of σ70 and σ38 regulons in RNAP-binding genes of each group. Orange circle, percentage of σ70 regulon; black square, percentage of σ38 regulon. ‘Others’ refers to genes controlled by unassigned sigma factor(s) and/or by sigma factors other than σ70 and σ38.

