Figure 3.

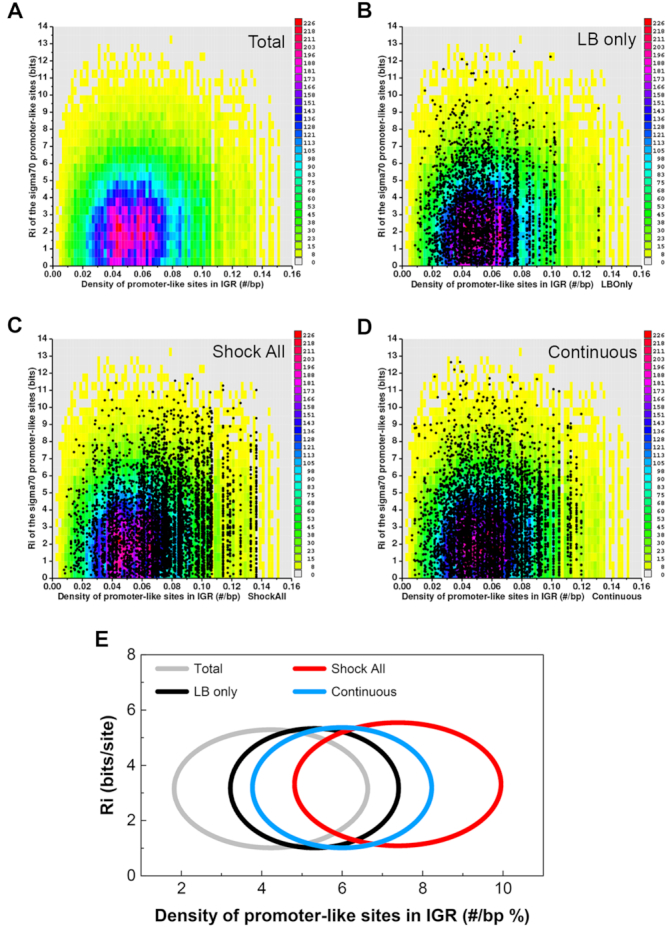
Hyperdensity of promoter-like sites at the intergenic regions of ‘Shock All’ genes. (A) Conservation and density of the σ70 promoter-like sites for all E. coli intergenic regions. Zero bits were used as the cutoff for finding the sites. Each colored rectangle represents the corresponding number of sites in the indicated conservation (bits) and density (#/bp). Scatter plots of all σ70 promoter-like sites at the intergenic regions of ‘LB only’ (B), ‘Shock All’ (C) and ‘Continuous’ (D) genes. The same colored background (as shown in panel A) represents a baseline. Each dot represents a predicted σ70 promoter site and is already represented in the colored reference background. (E) Conservation and density of the σ70 promoter-like sites in each subset are shown by ellipses. Total, the σ70 promoter-like sites of all intergenic regions in the E. coli genome are used as a control. The data shown above are summarized using ellipses. The center of each ellipse represents the average information content (y-axis) and density of the predicted promoters (x-axis) of the corresponding subset. Standard deviation of the information content and promoter density is used as the semi-minor axis and semi-major axis to plot the ellipse, respectively.
