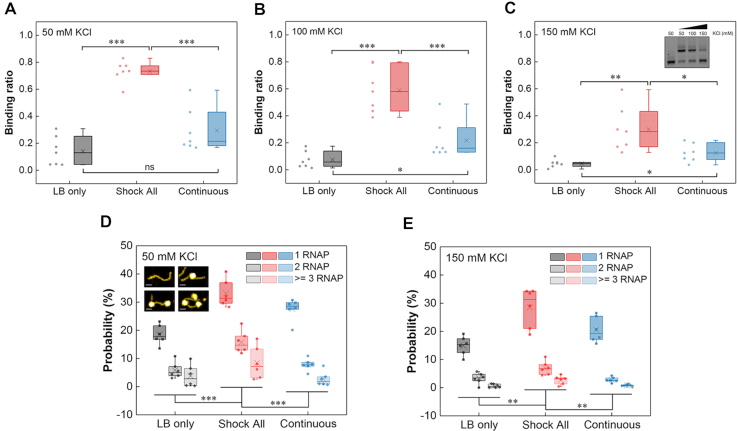
Figure 4.
RNAP binding to the intergenic regions of ‘LB only’, ‘Shock All’ and ‘Continuous’ genes. Boxplots show the RNAP binding to the intergenic regions of ‘LB only’, ‘Shock All’ and ‘Continuous’ at 50 mM KCl (A), 100 mM KCl (B) and 150 mM KCl (C). Each boxplot is based on the dots on the left side. Inset shows the representative RNAP binding to a ‘Shock All’ intergenic region (dhaK-dhaR) at different KCl concentrations. AFM analysis showing the RNAP binding number per DNA molecule in the intergenic regions of ‘LB only’, ‘Shock All’ and ‘Continuous’ at 50 mM KCl (D) and 150 mM KCl (E). Generally, 150–850 DNAs of each intergenic region from two repeats in every viewing field were examined for analysis. Insets show the DNA without and with RNAP (1, 2, and 3) binding by AFM; scale bar, 25 nm. Each boxplot shows the probability of RNAP binding. Each dot represents an intergenic region with the mean promoter density of the corresponding subset. The boxes indicate the lower (25%) and upper (75%) quartiles; the solid lines and crosses represent the median and mean, respectively. The data were compared by two-sided t-test (***P ≤ 0.001; **P ≤ 0.01; *P ≤ 0.05; ns, P > 0.05).

