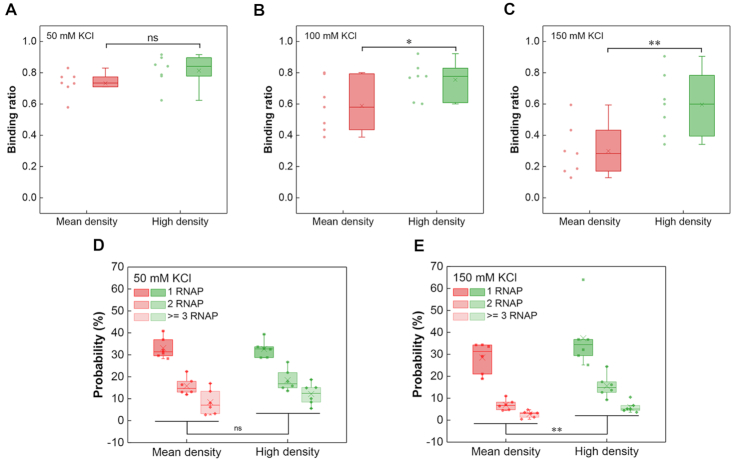
Figure 5.
High promoter density of ‘Shock All’ genes corresponds to high RNAP binding. Boxplots of RNAP binding to the ‘Shock All’ intergenic regions with mean or high promoter density at 50 mM KCl (A), 100 mM KCl (B) and 150 mM KCl (C). RNAP binding number per DNA molecule at 50 mM KCl (D) and 150 mM KCl (E) in the ‘Shock All’ intergenic regions measured by AFM. The ‘Shock All’ intergenic regions with high promoter density (puuA-puuD, gspA-gspC, leuL-leuO, ycgX-iraM, bluF-ycgZ and dcuC-pagP) were used for AFM imaging. The analysis was based on 150–850 DNAs examined for the above intergenic regions in each viewing field. Each dot represents an intergenic region with the mean or high promoter density of the corresponding group. The two-sided t-test was applied for statistical analysis (**P ≤ 0.01; *P ≤ 0.05; ns, P > 0.05).

